QC Figures
If you have any questions or issues, feel free to open an issue or directly email Drew Neavin (d.neavin @ garvan.org.au)
In the last step, Demultiplexing and Doublet Removal, you identified droplets that contained a single cell and assigned them to the correct individual. Next, we will use typical scRNA-seq QC metrics to assess the quality of those singlets and remove cells that don’t pass those QC thresholds. For clarity, in the Demultiplexing and Doublet Removal example we used just one pool. To look at the QC metrics figures, we will be using the results from two pools so we can easily see a comparison between the two pools. The QC metrics that the pipeline provides figures for by default are:
Mitochondrial percent
Ribosomal percent
Number UMIs
Number features
You will see three violin plots for each of these QC metrics. These have the pools on the x-axis and the QC metric on the y-axis.
One of the plots are the violin plots without any additional information:
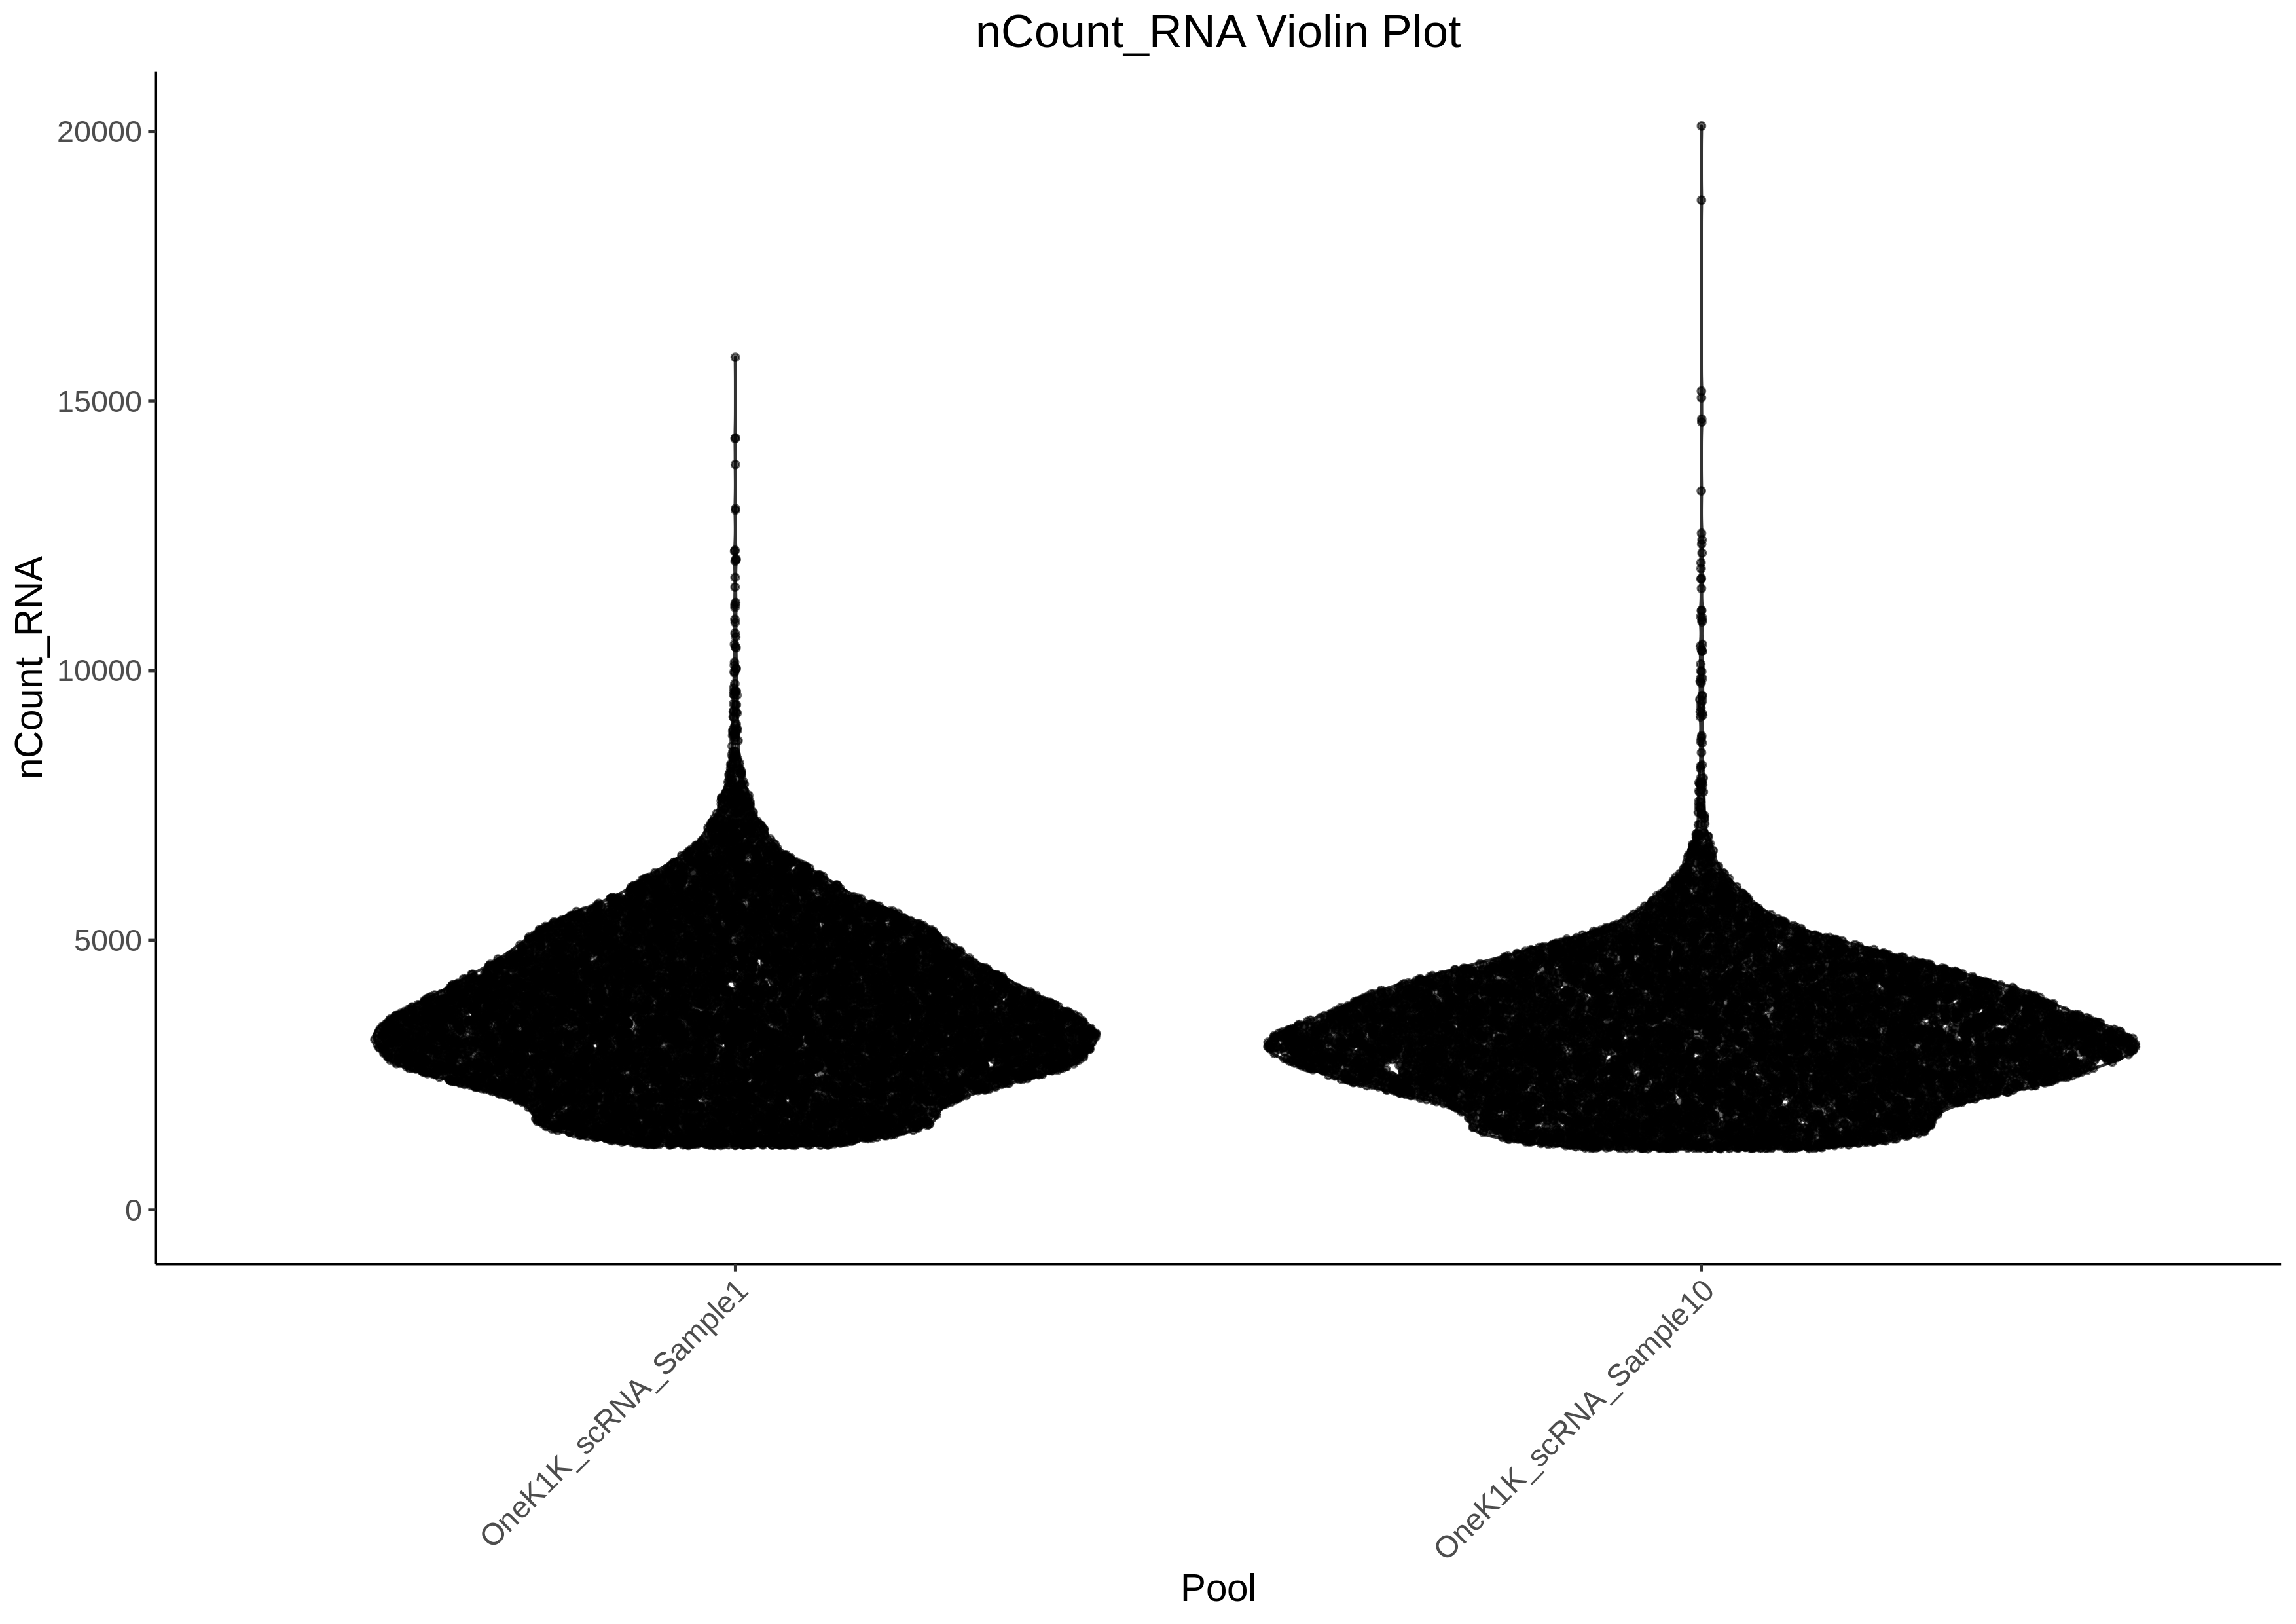
Number UMIs
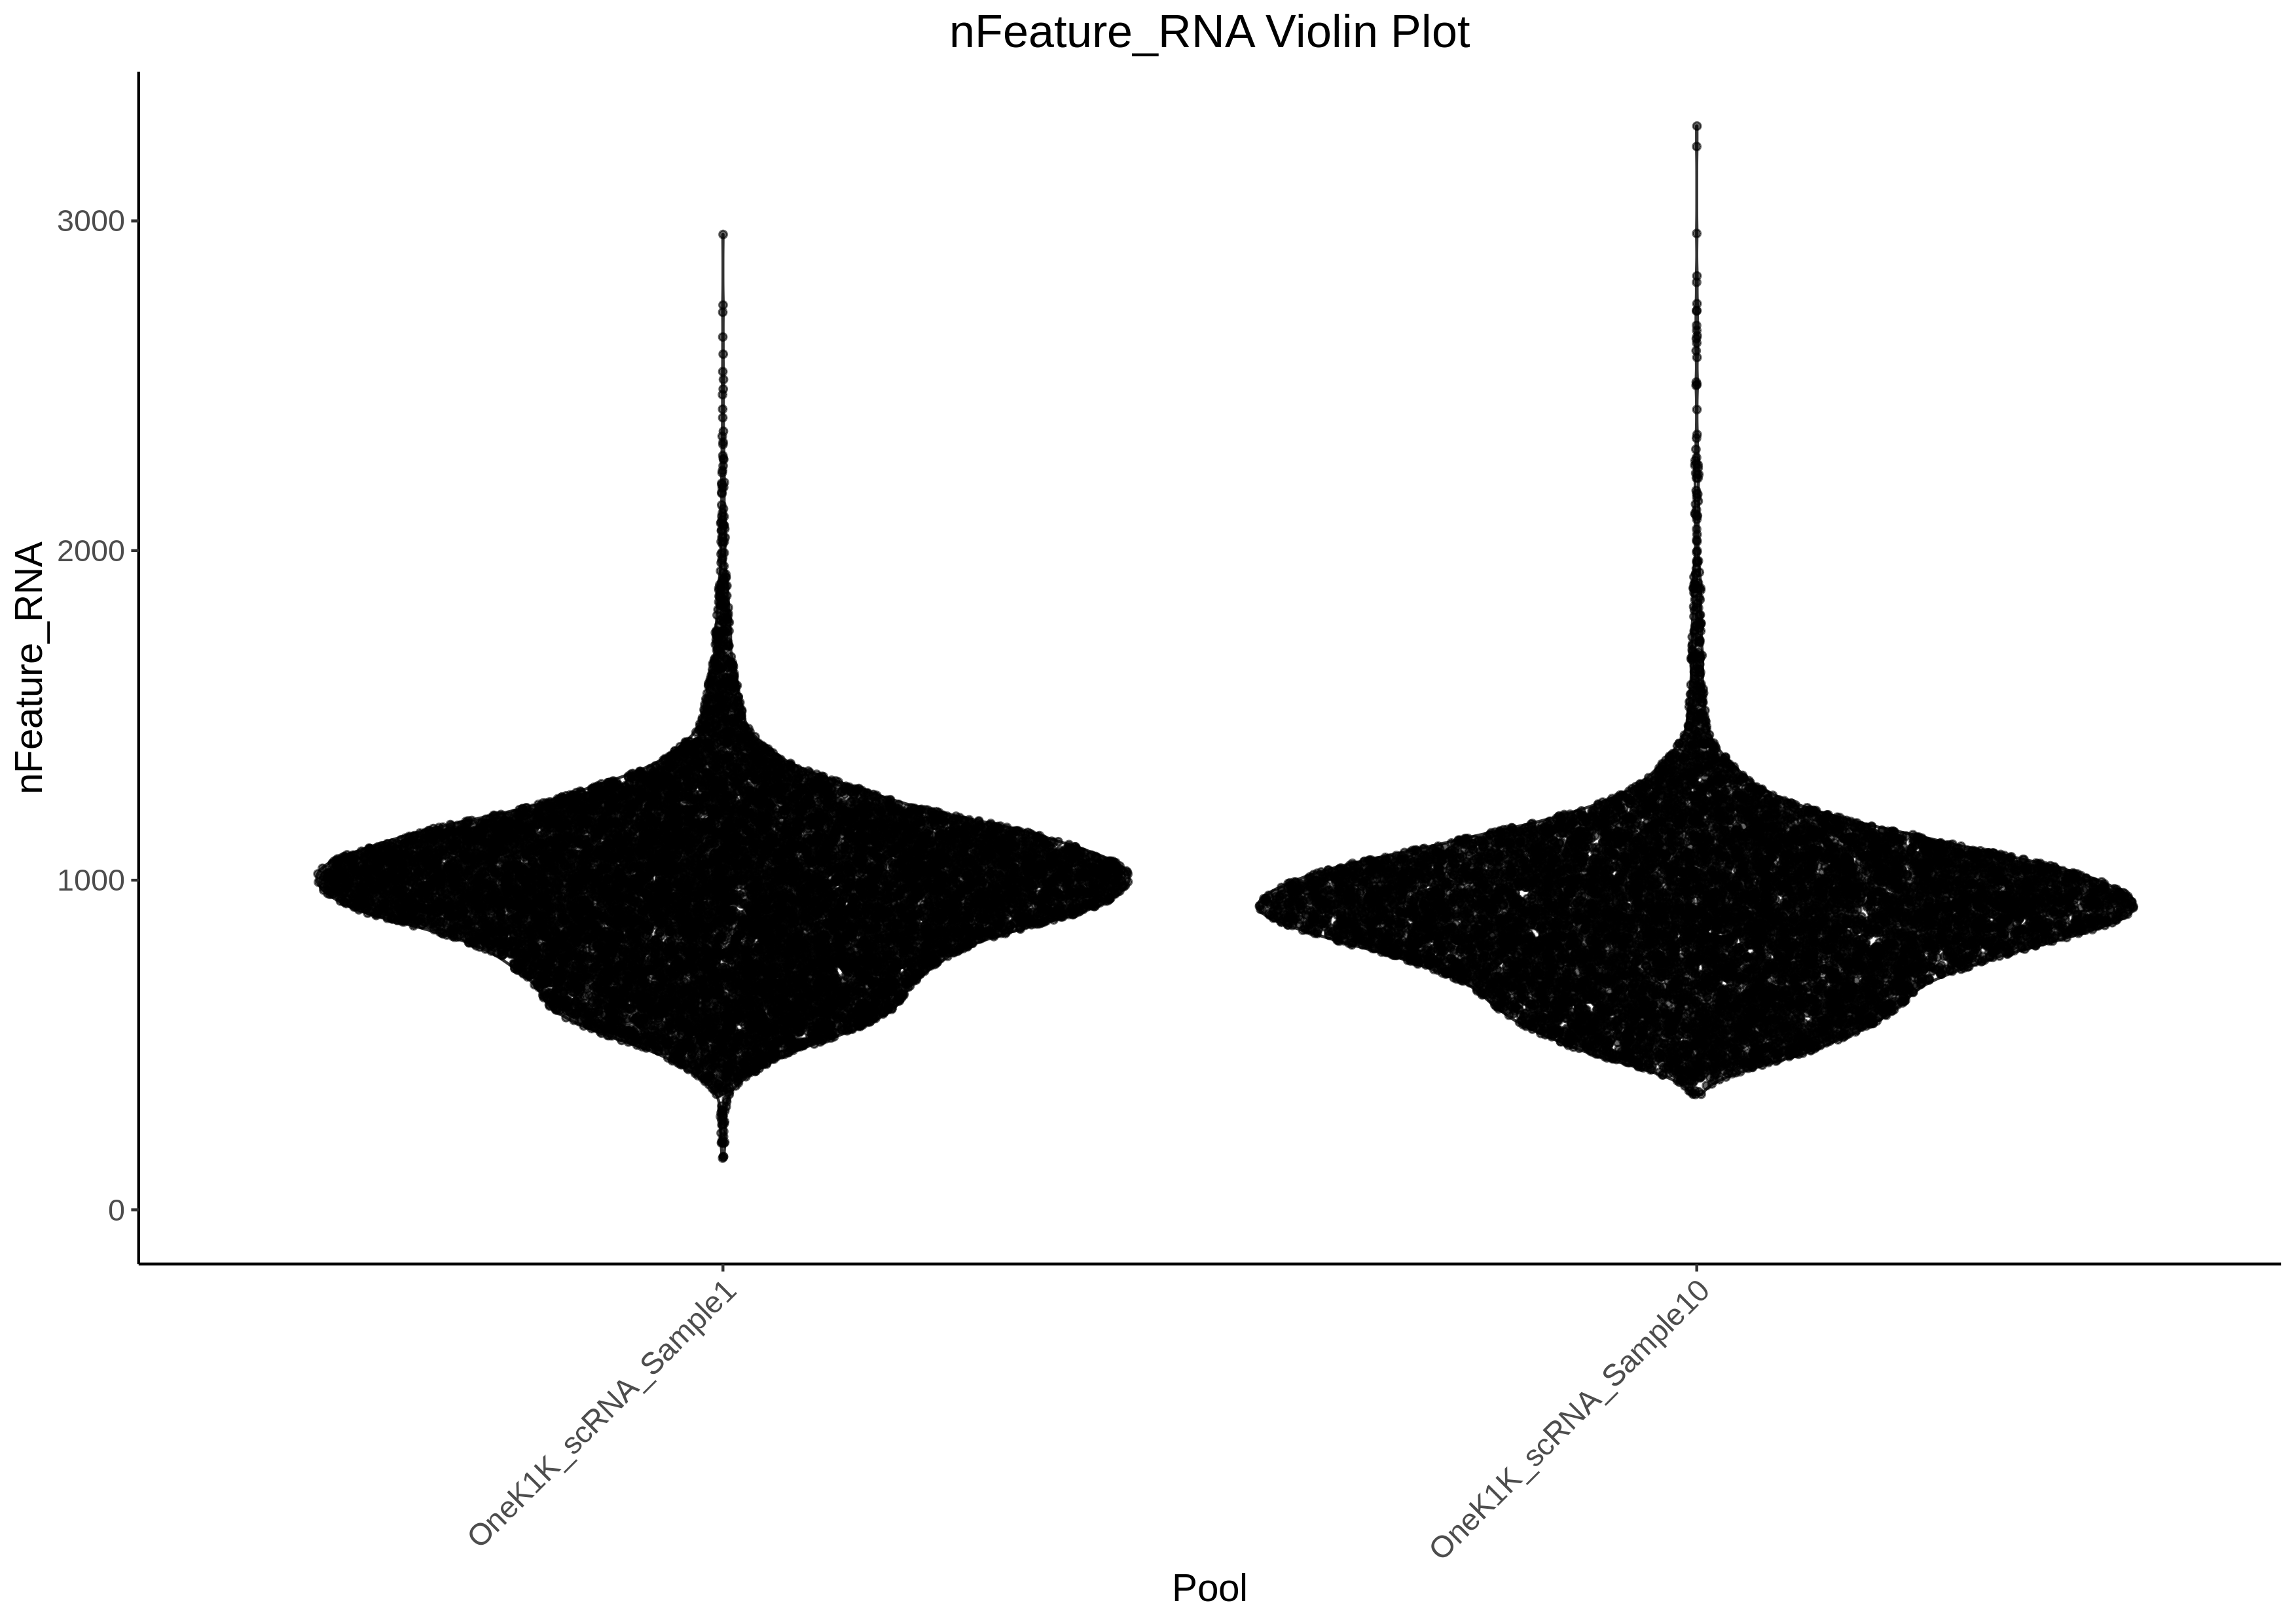
Number Genes Detected

Ribosomal Percent
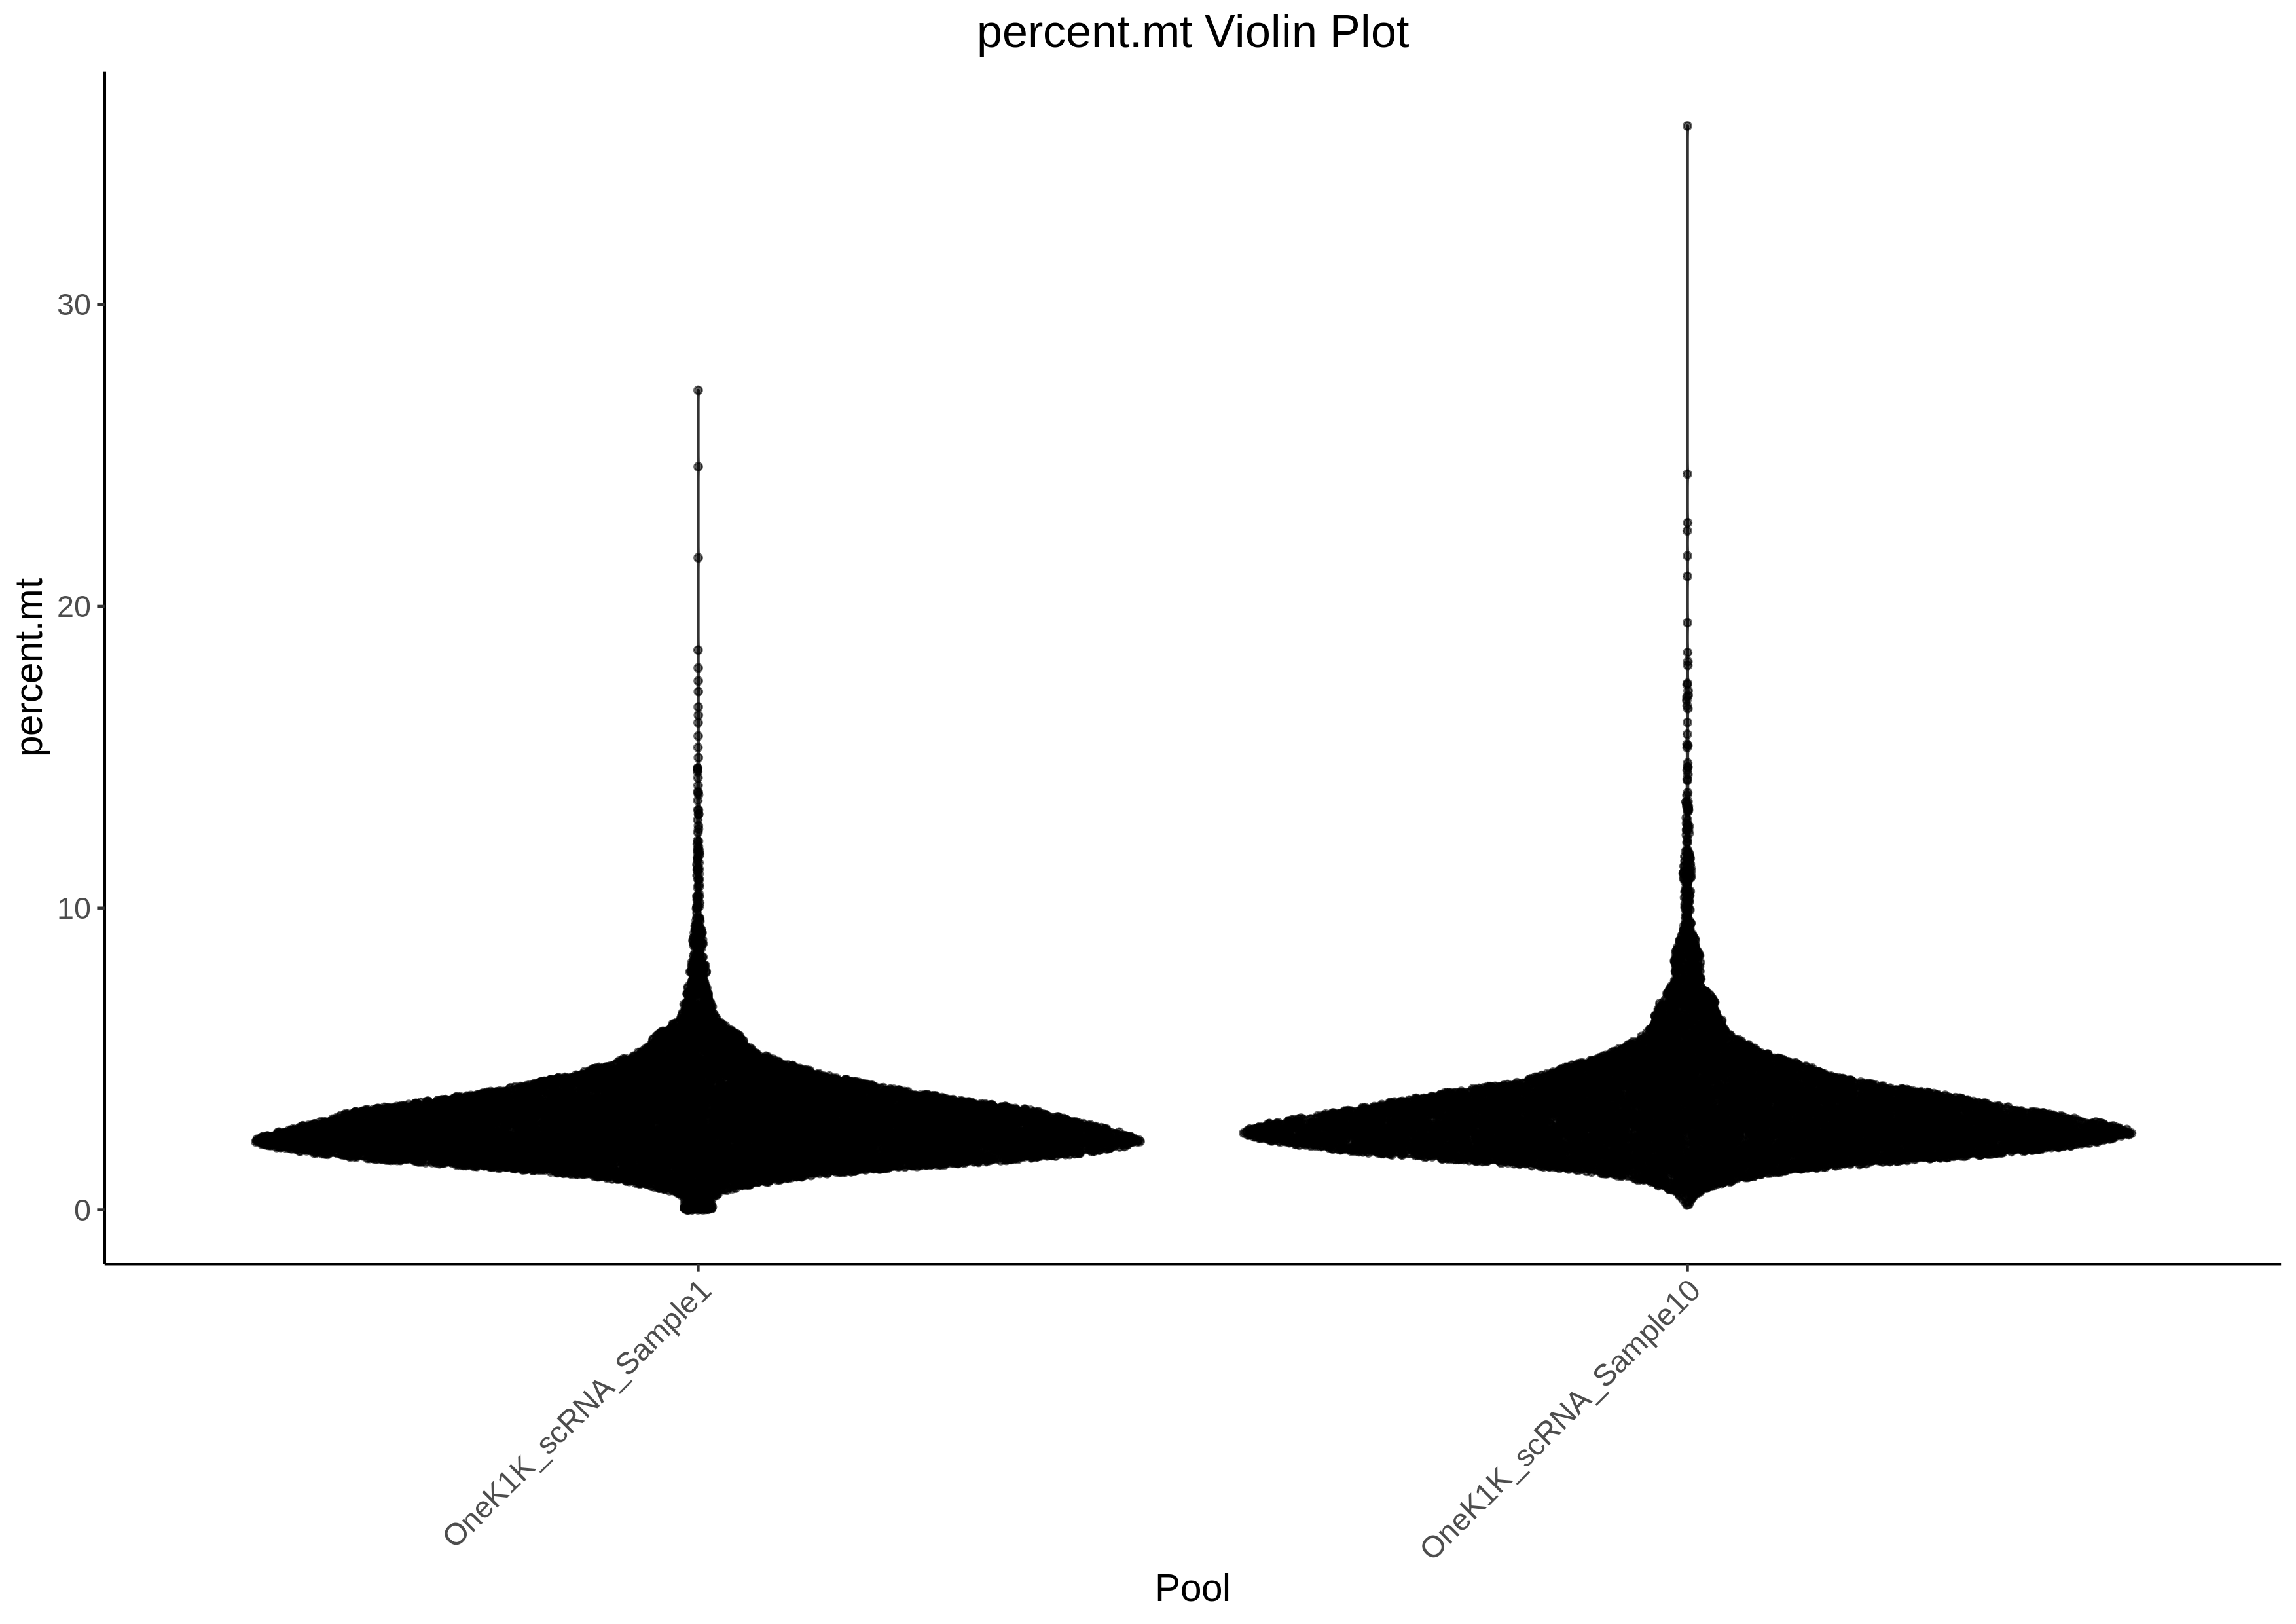
Mitochondrial Percent
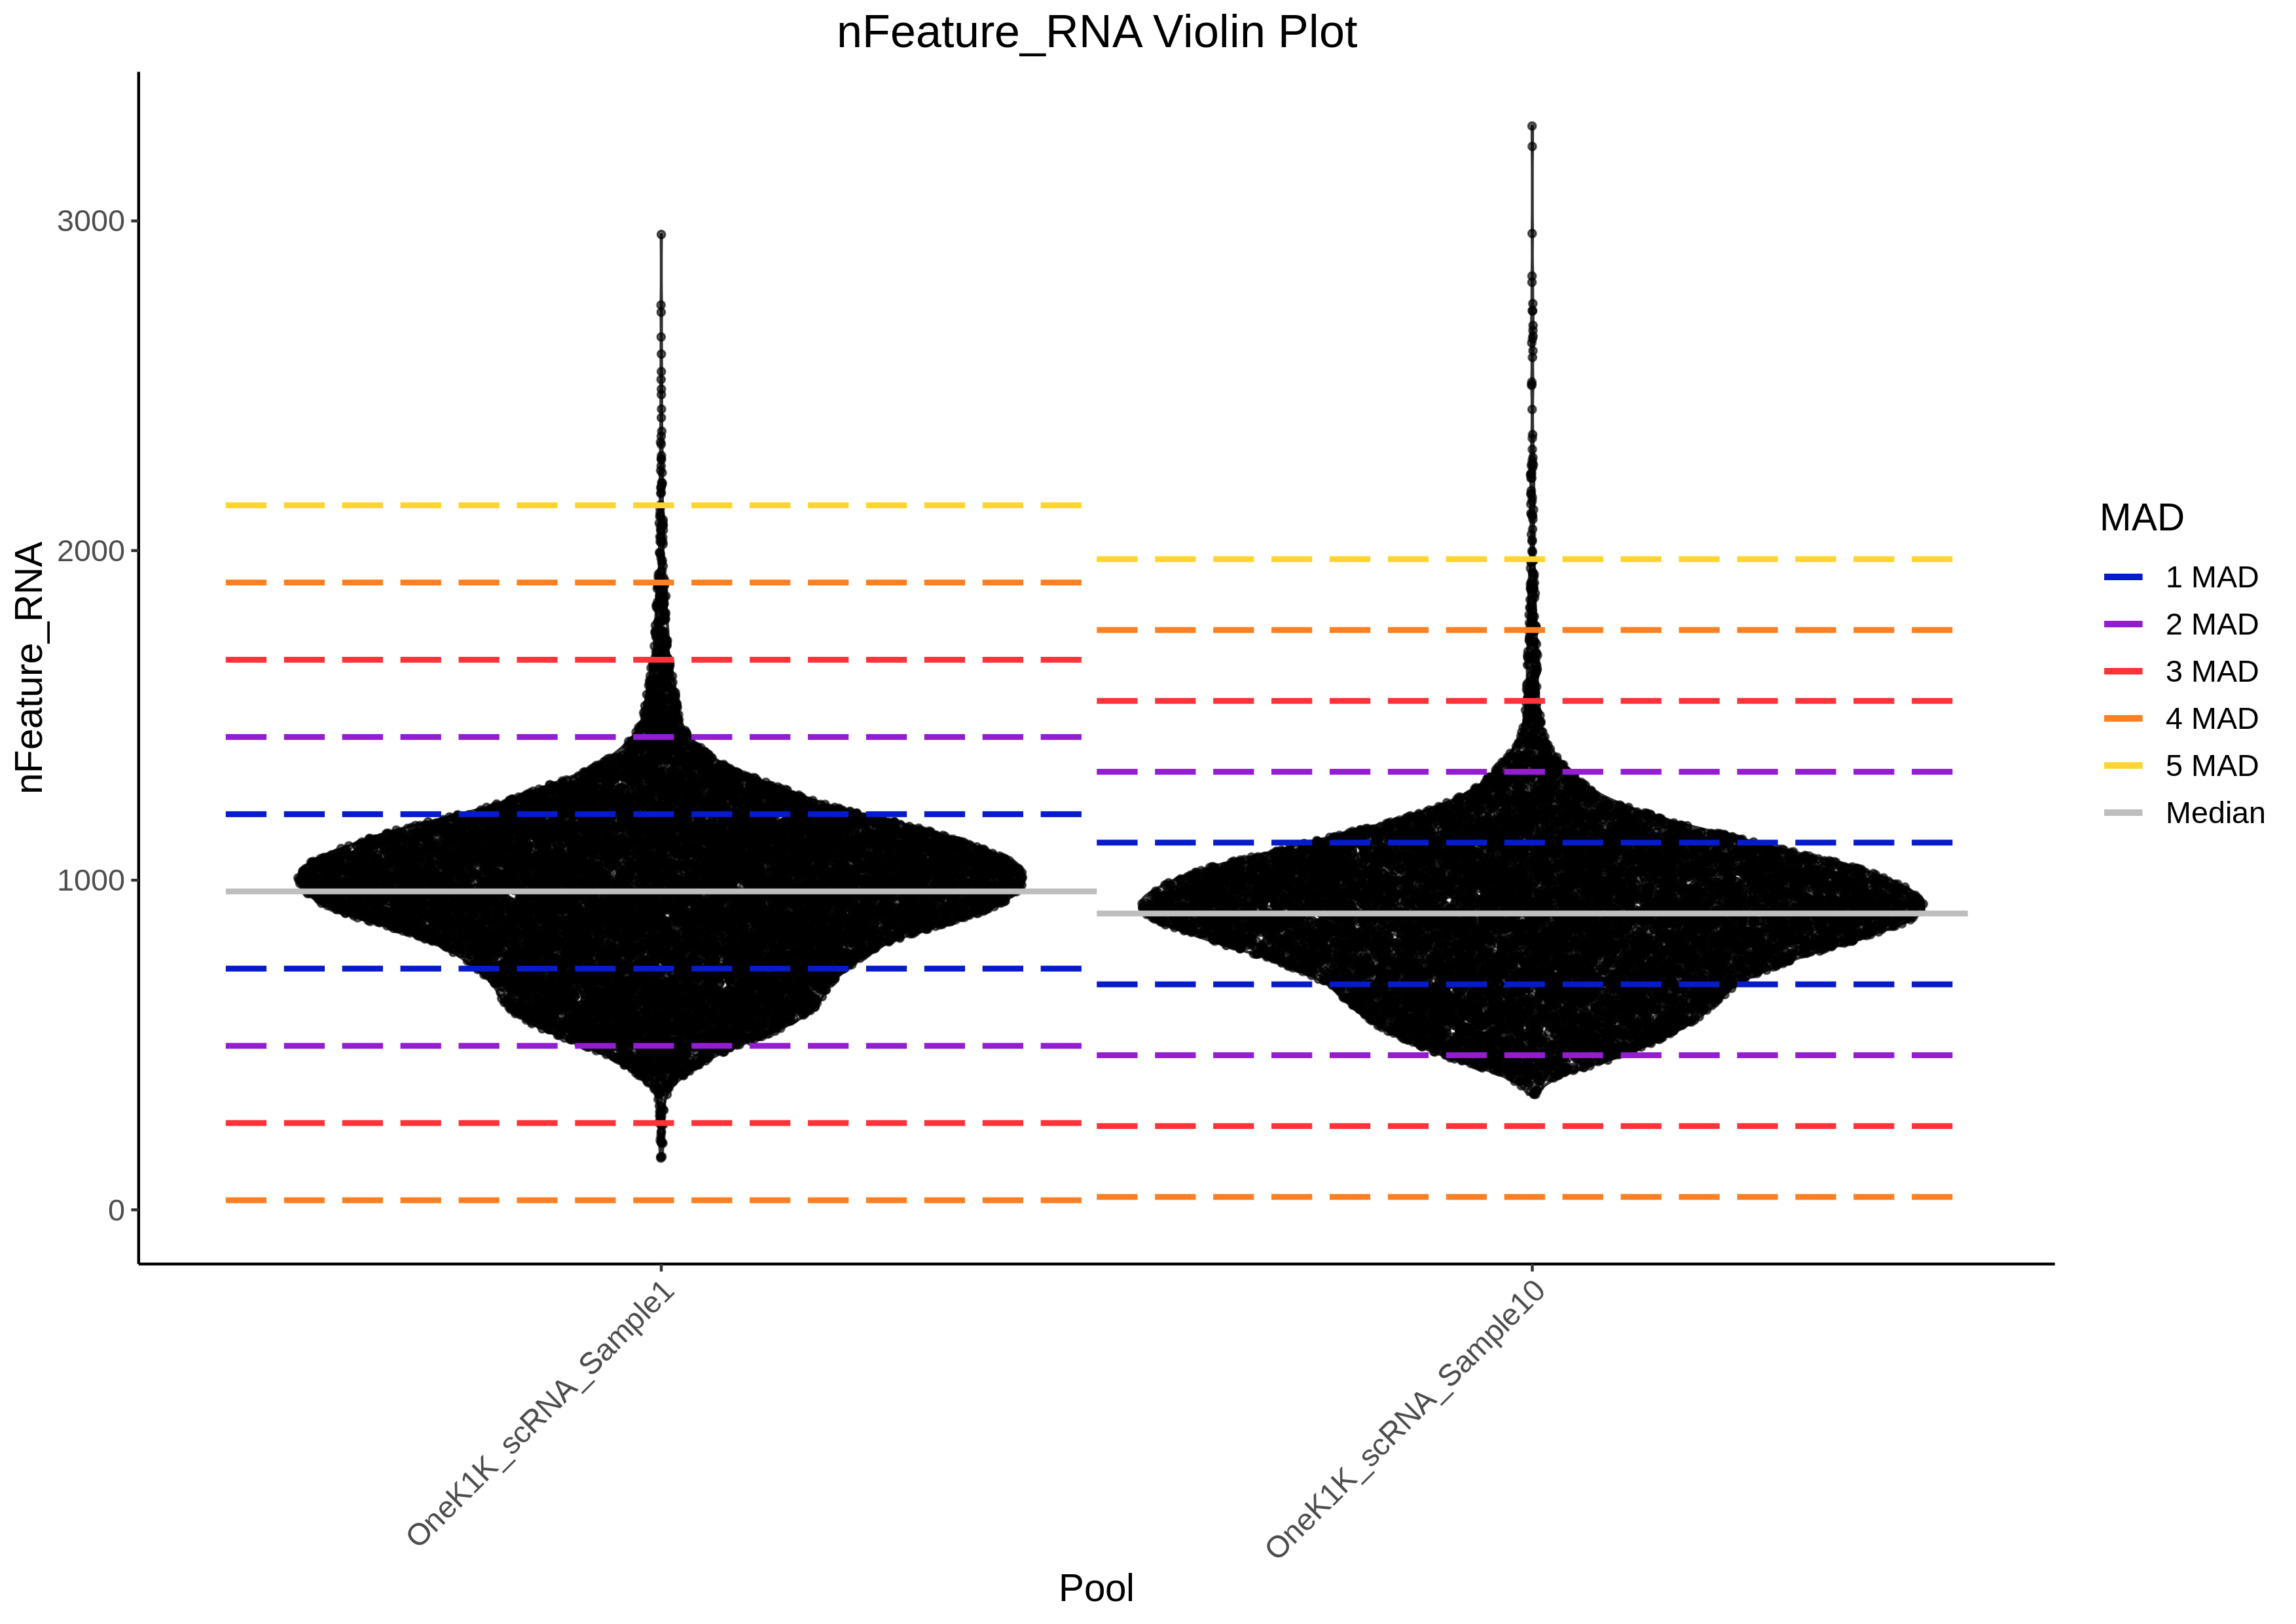
One of the plots will have the lines indicating the median and different median absolute deviations (MADs) from the median for all the pools together. This will be useful to discuss the possibility of using a single filtering threshold across all pools. The median is in grey, 1 MAD is in blue, 2 MADs is in purple, 3 MADs is in red, 4 MADs is in orange and 5 MADs is in yellow:

Number UMIs
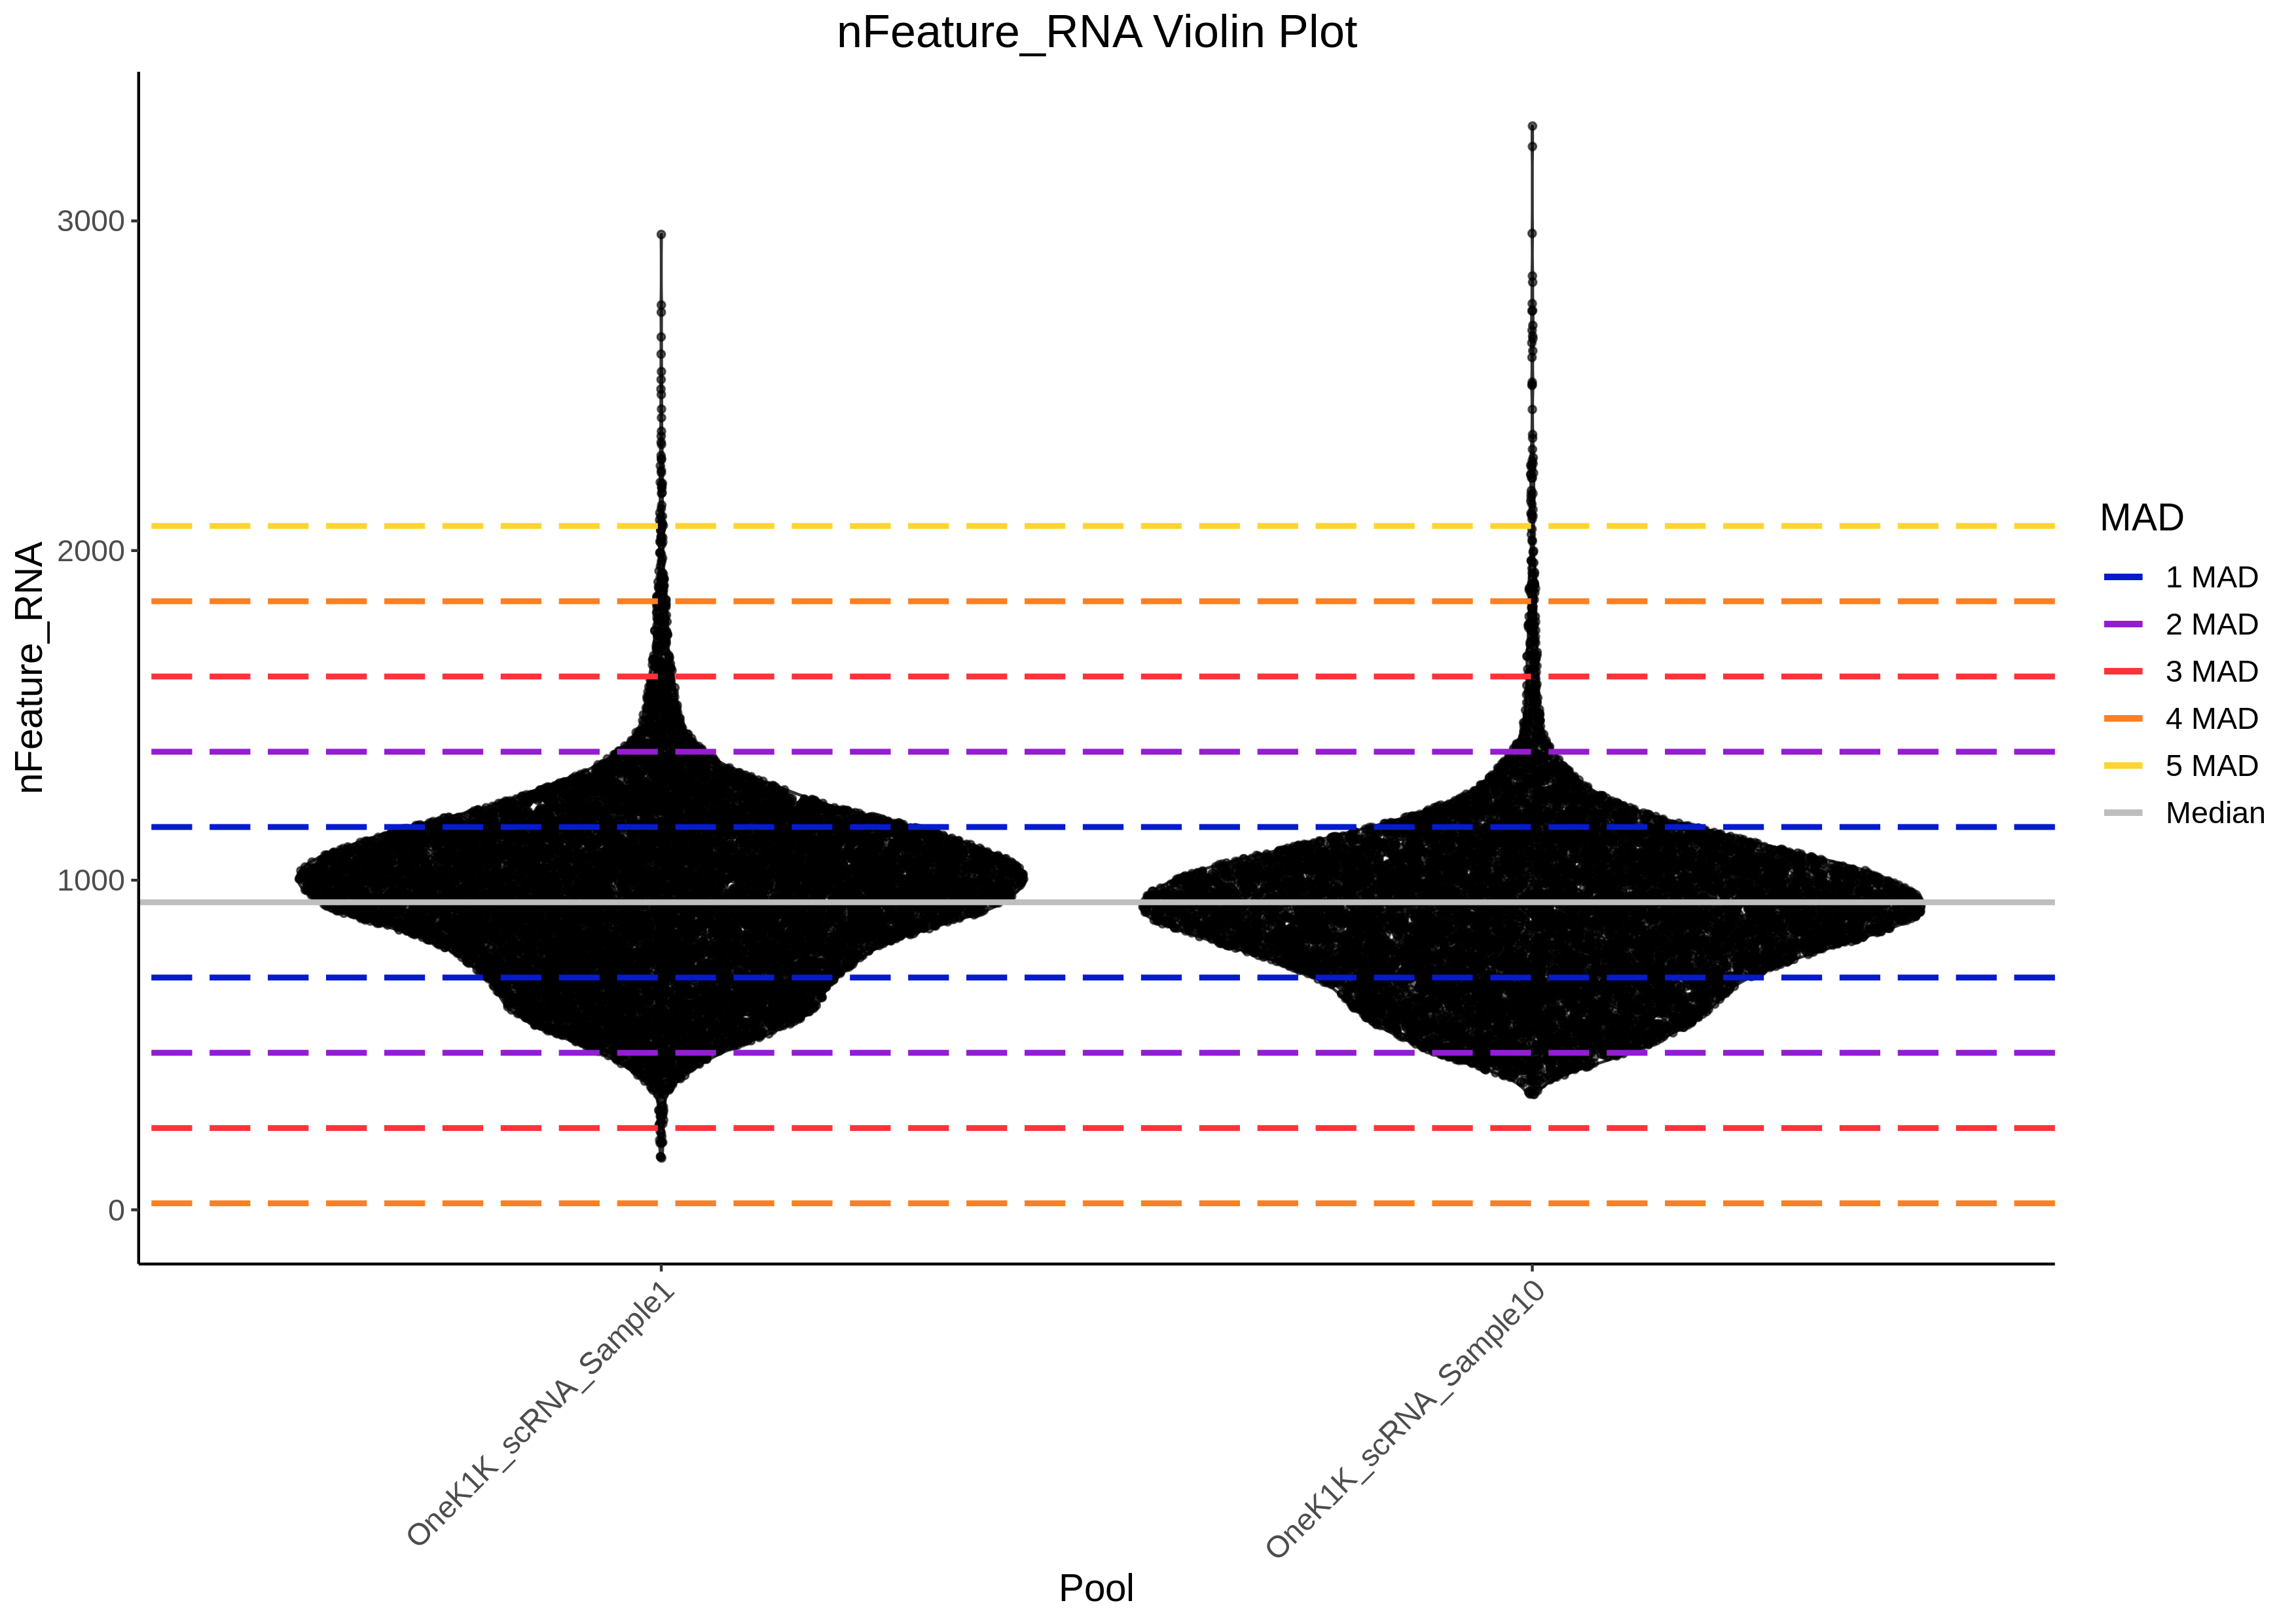
Number Genes Detected

Ribosomal Percent
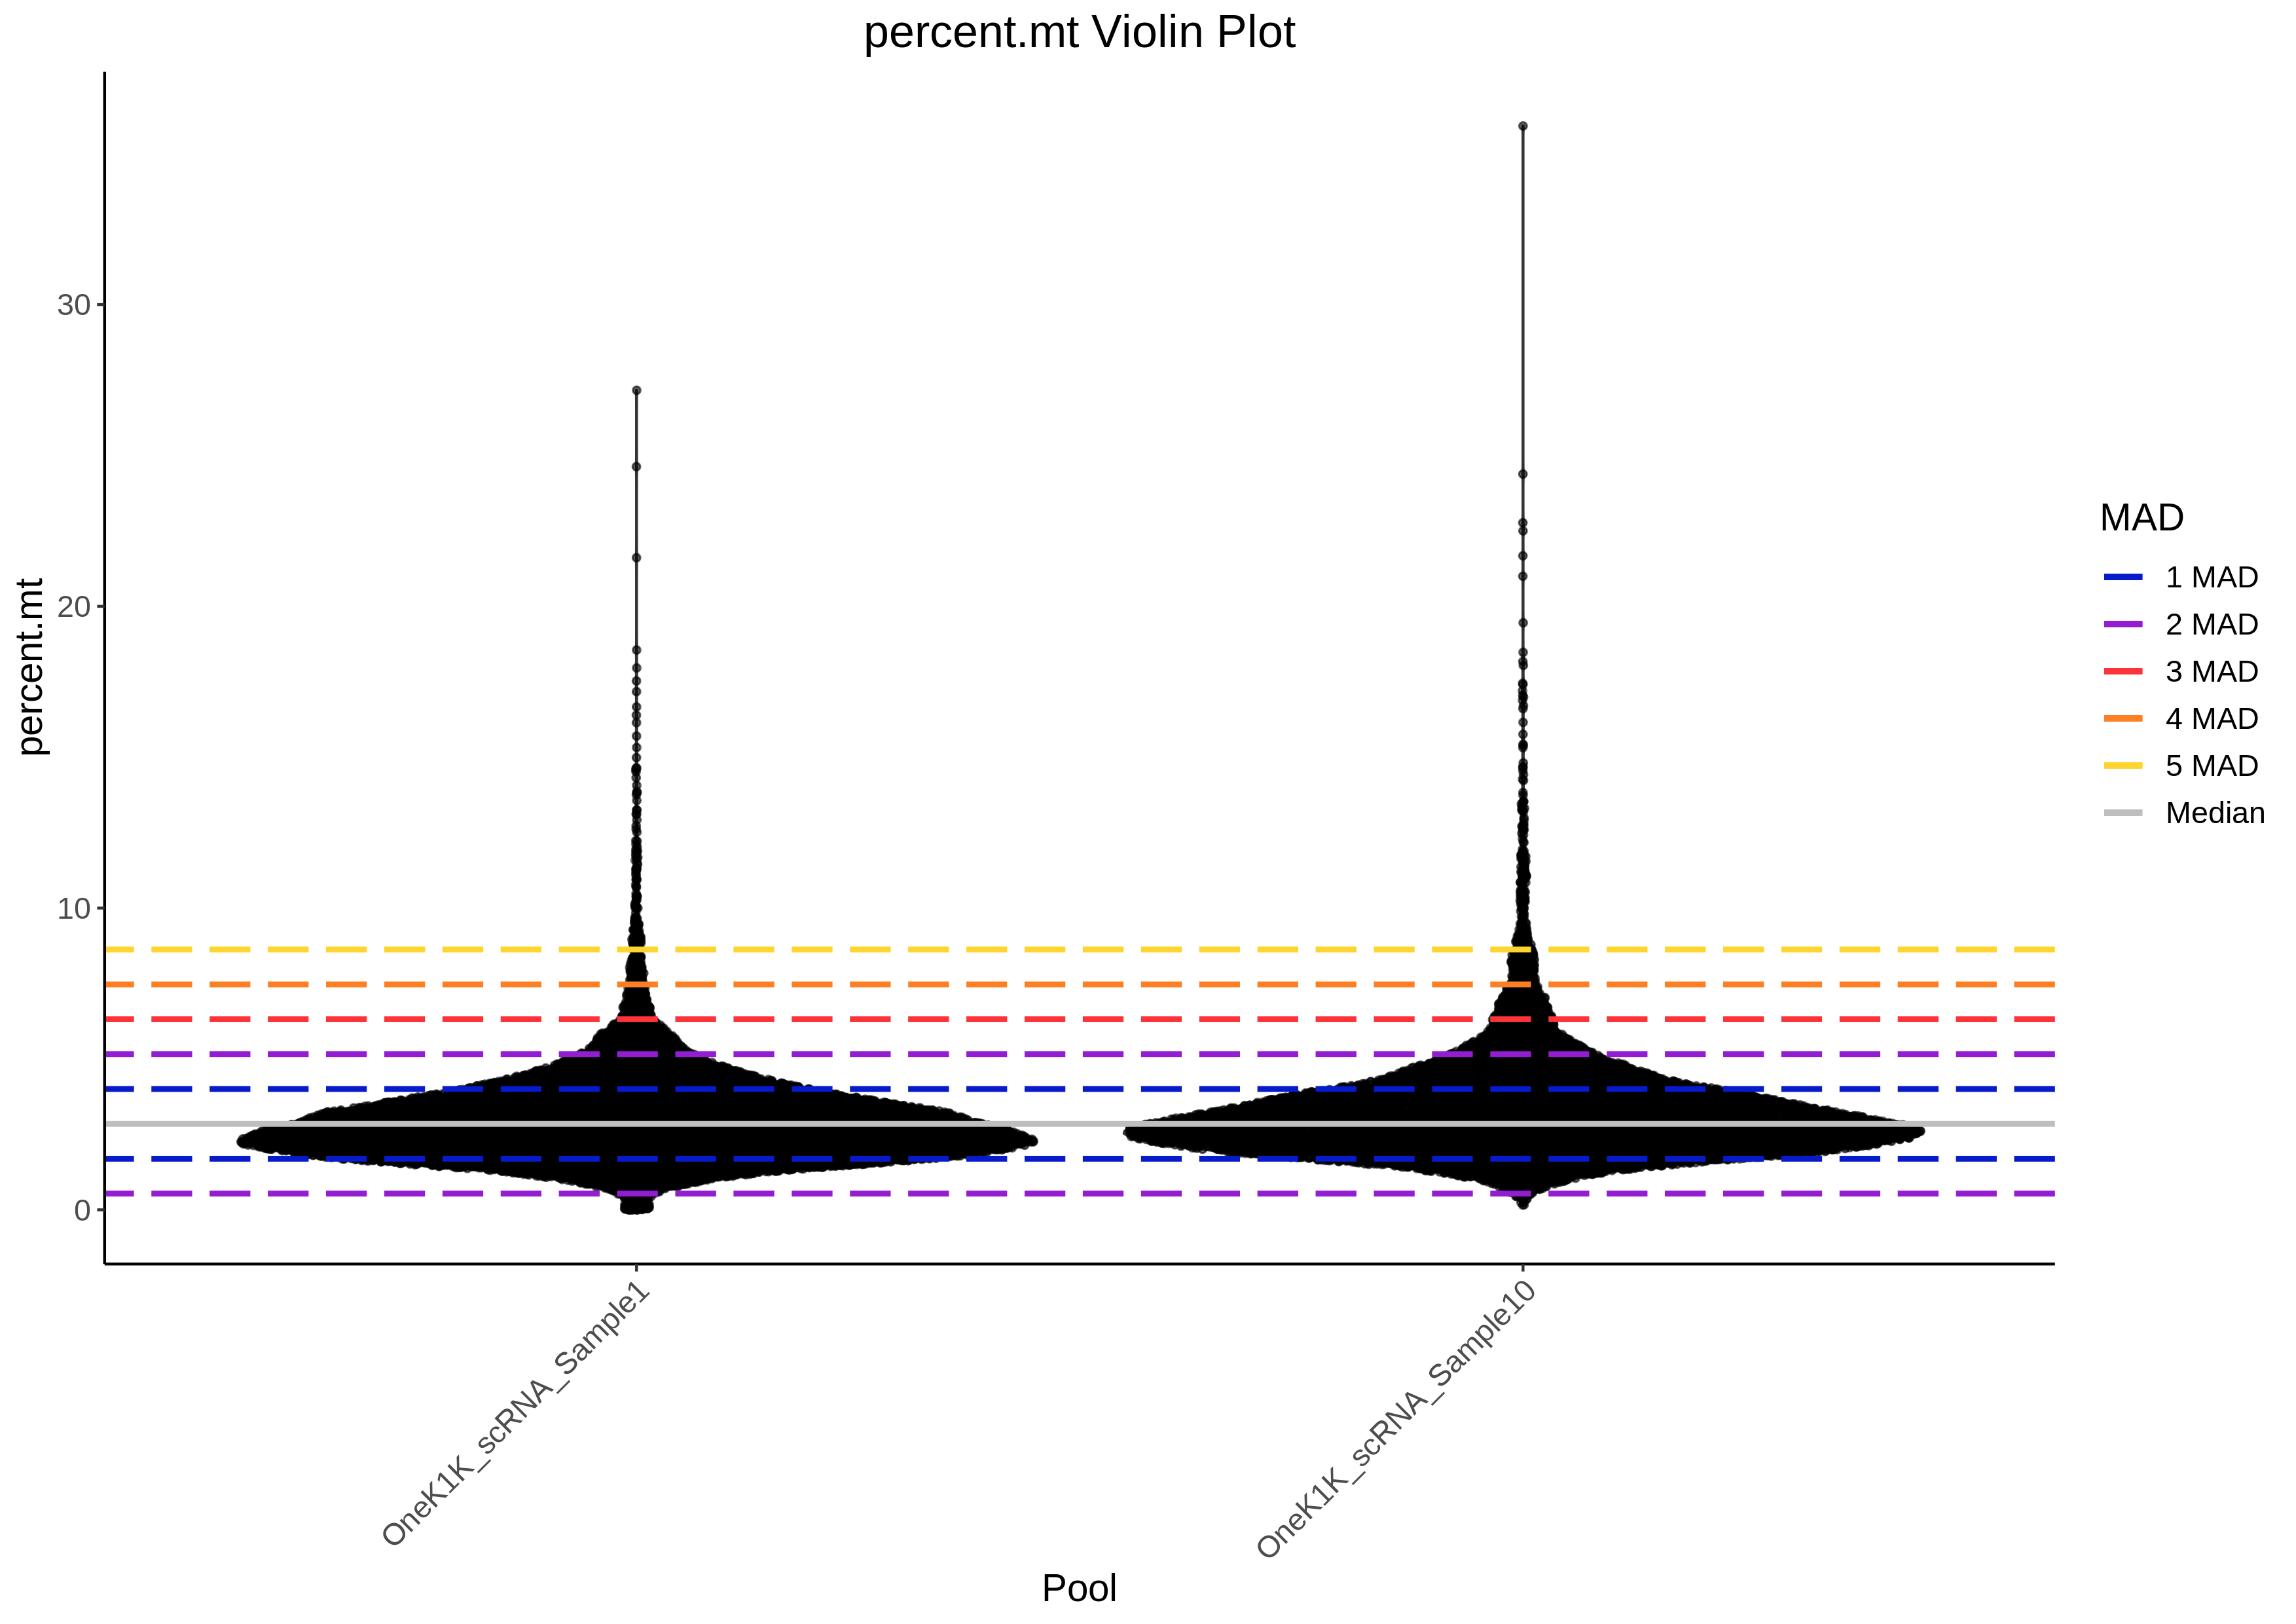
Mitochondrial Percent
One of the plots will have the lines indicating the median and different median absolute deviations (MADs) from the median for each pool separately. This will be helpful to demonstrate possible pool-specific QC metrics and will be helpful in trying to decide if the pools shoudld each be filtered with a different threshold or if a common filtering threshold can be used for all the pools. The median is in grey, 1 MAD is in blue, 2 MADs is in purple, 3 MADs is in red, 4 MADs is in orange and 5 MADs is in yellow:

Number UMIs
Number Genes Detected
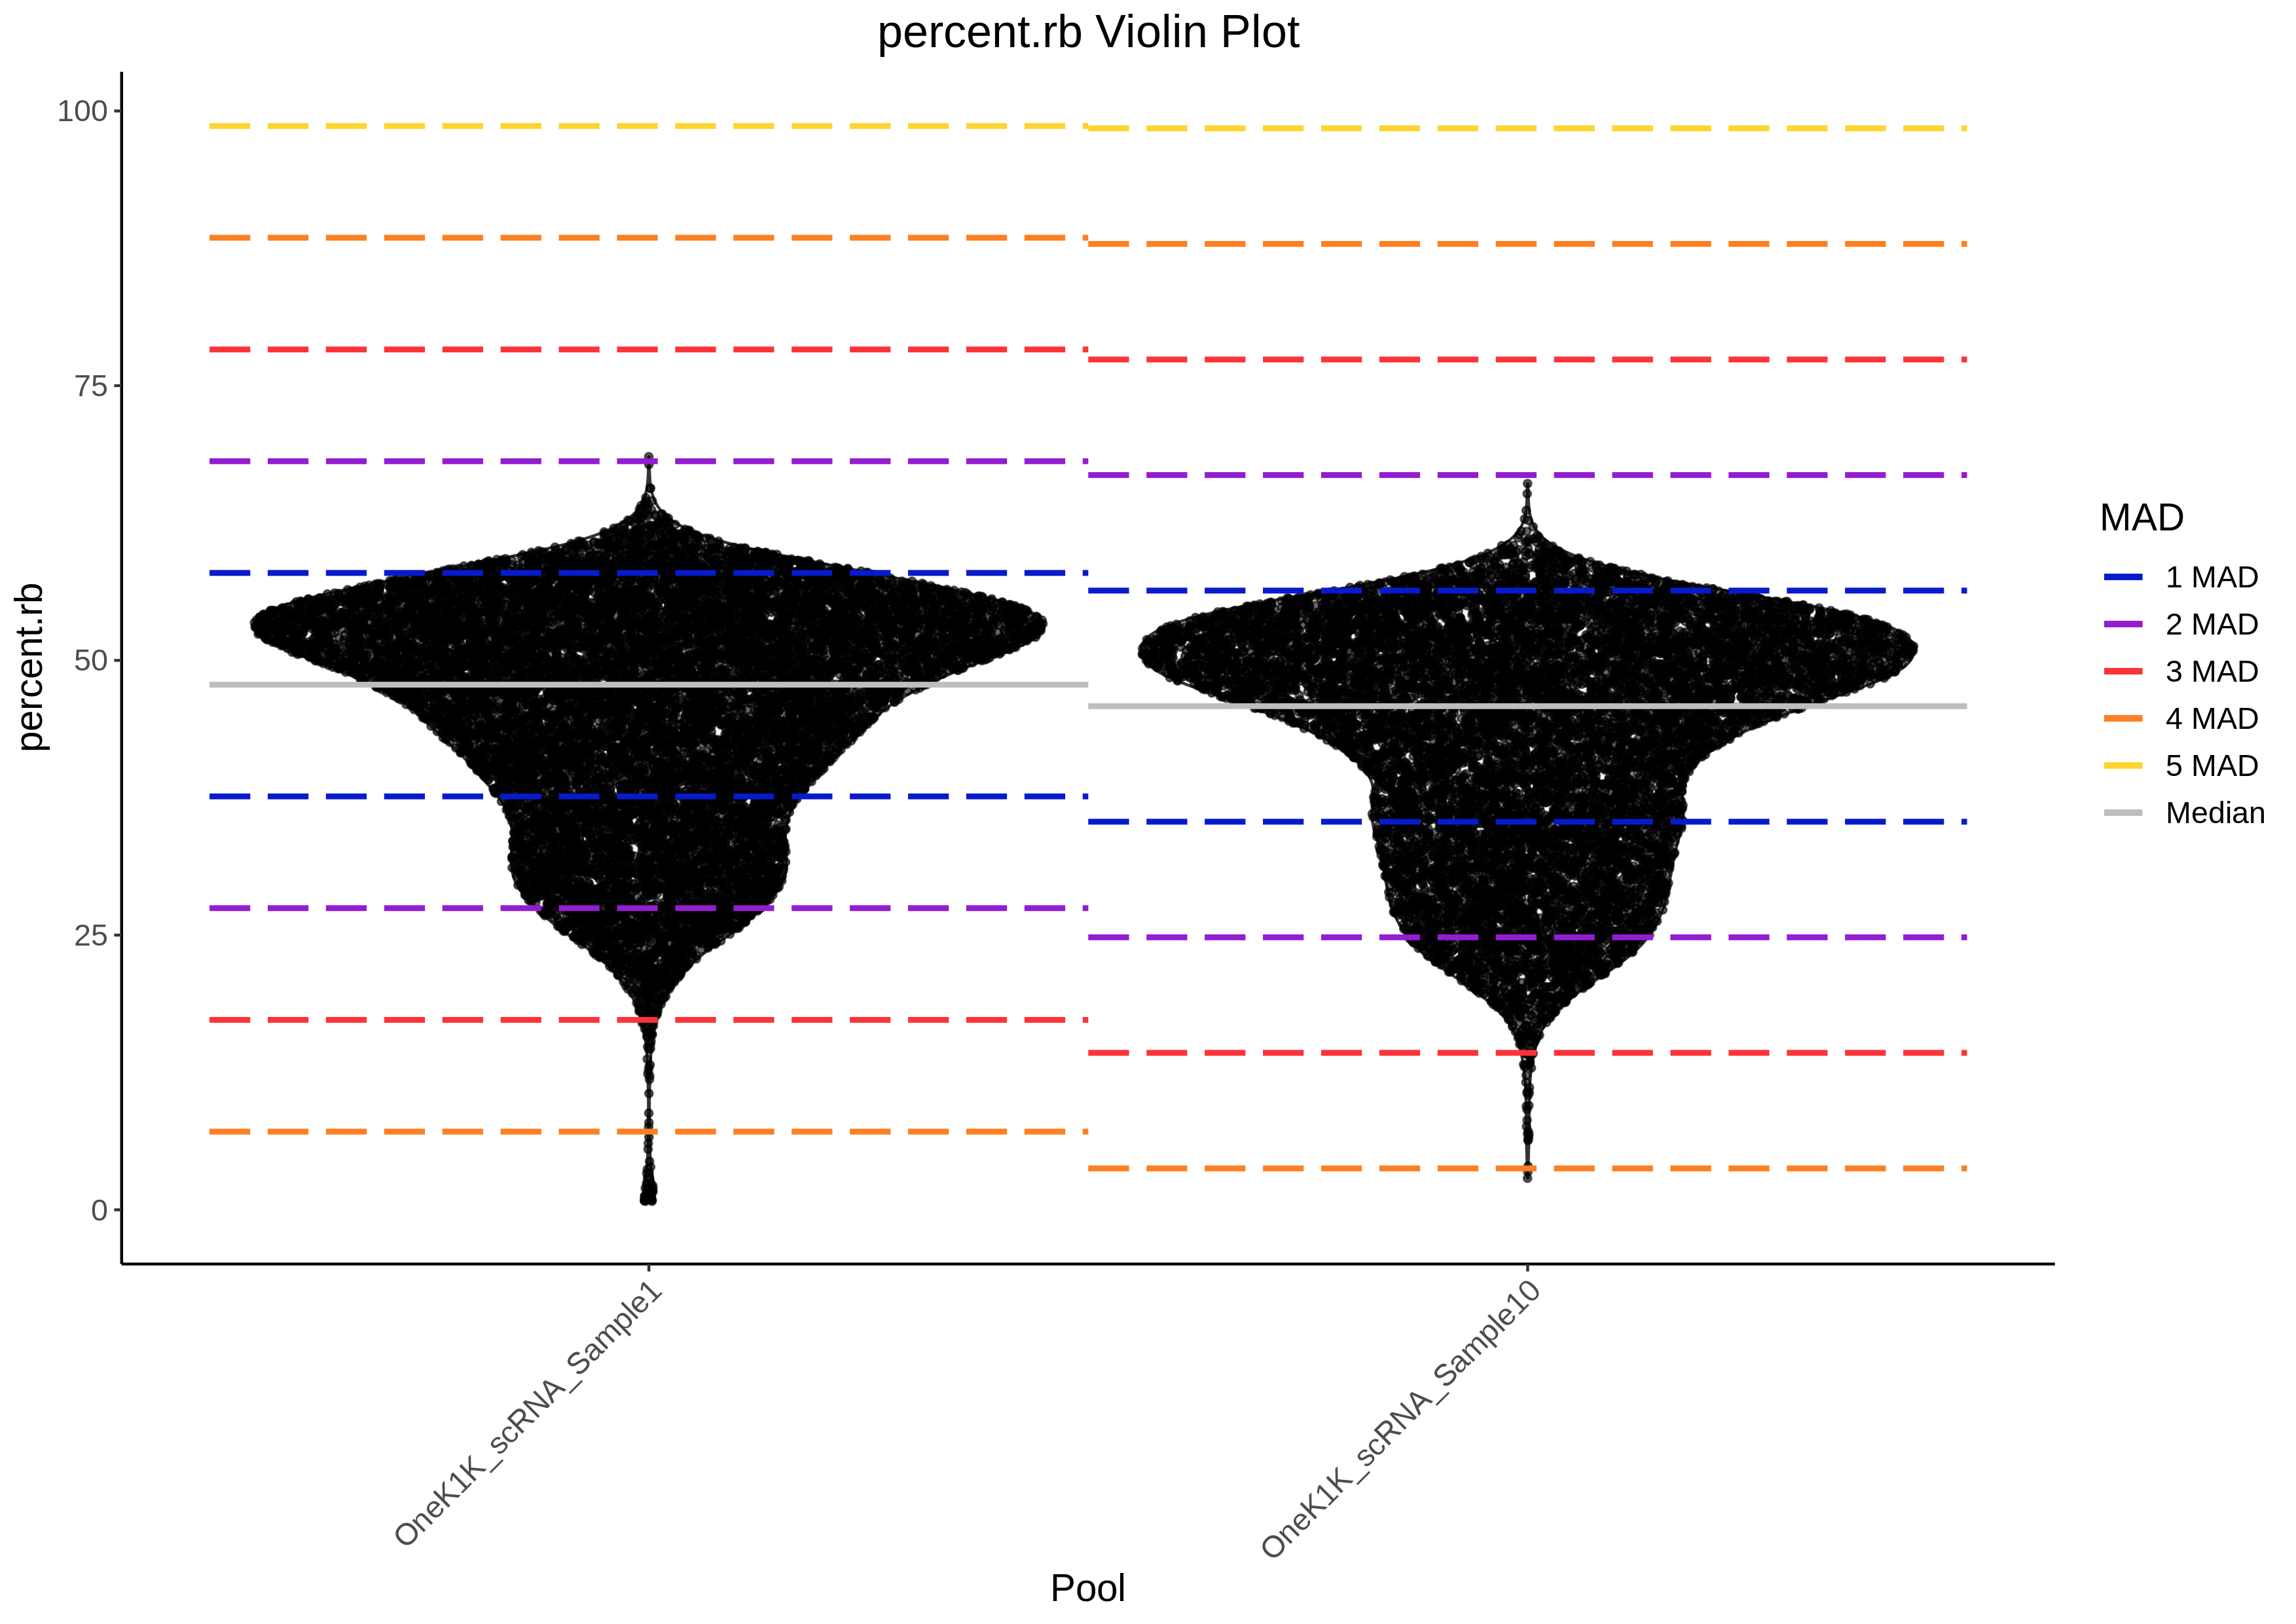
Ribosomal Percent
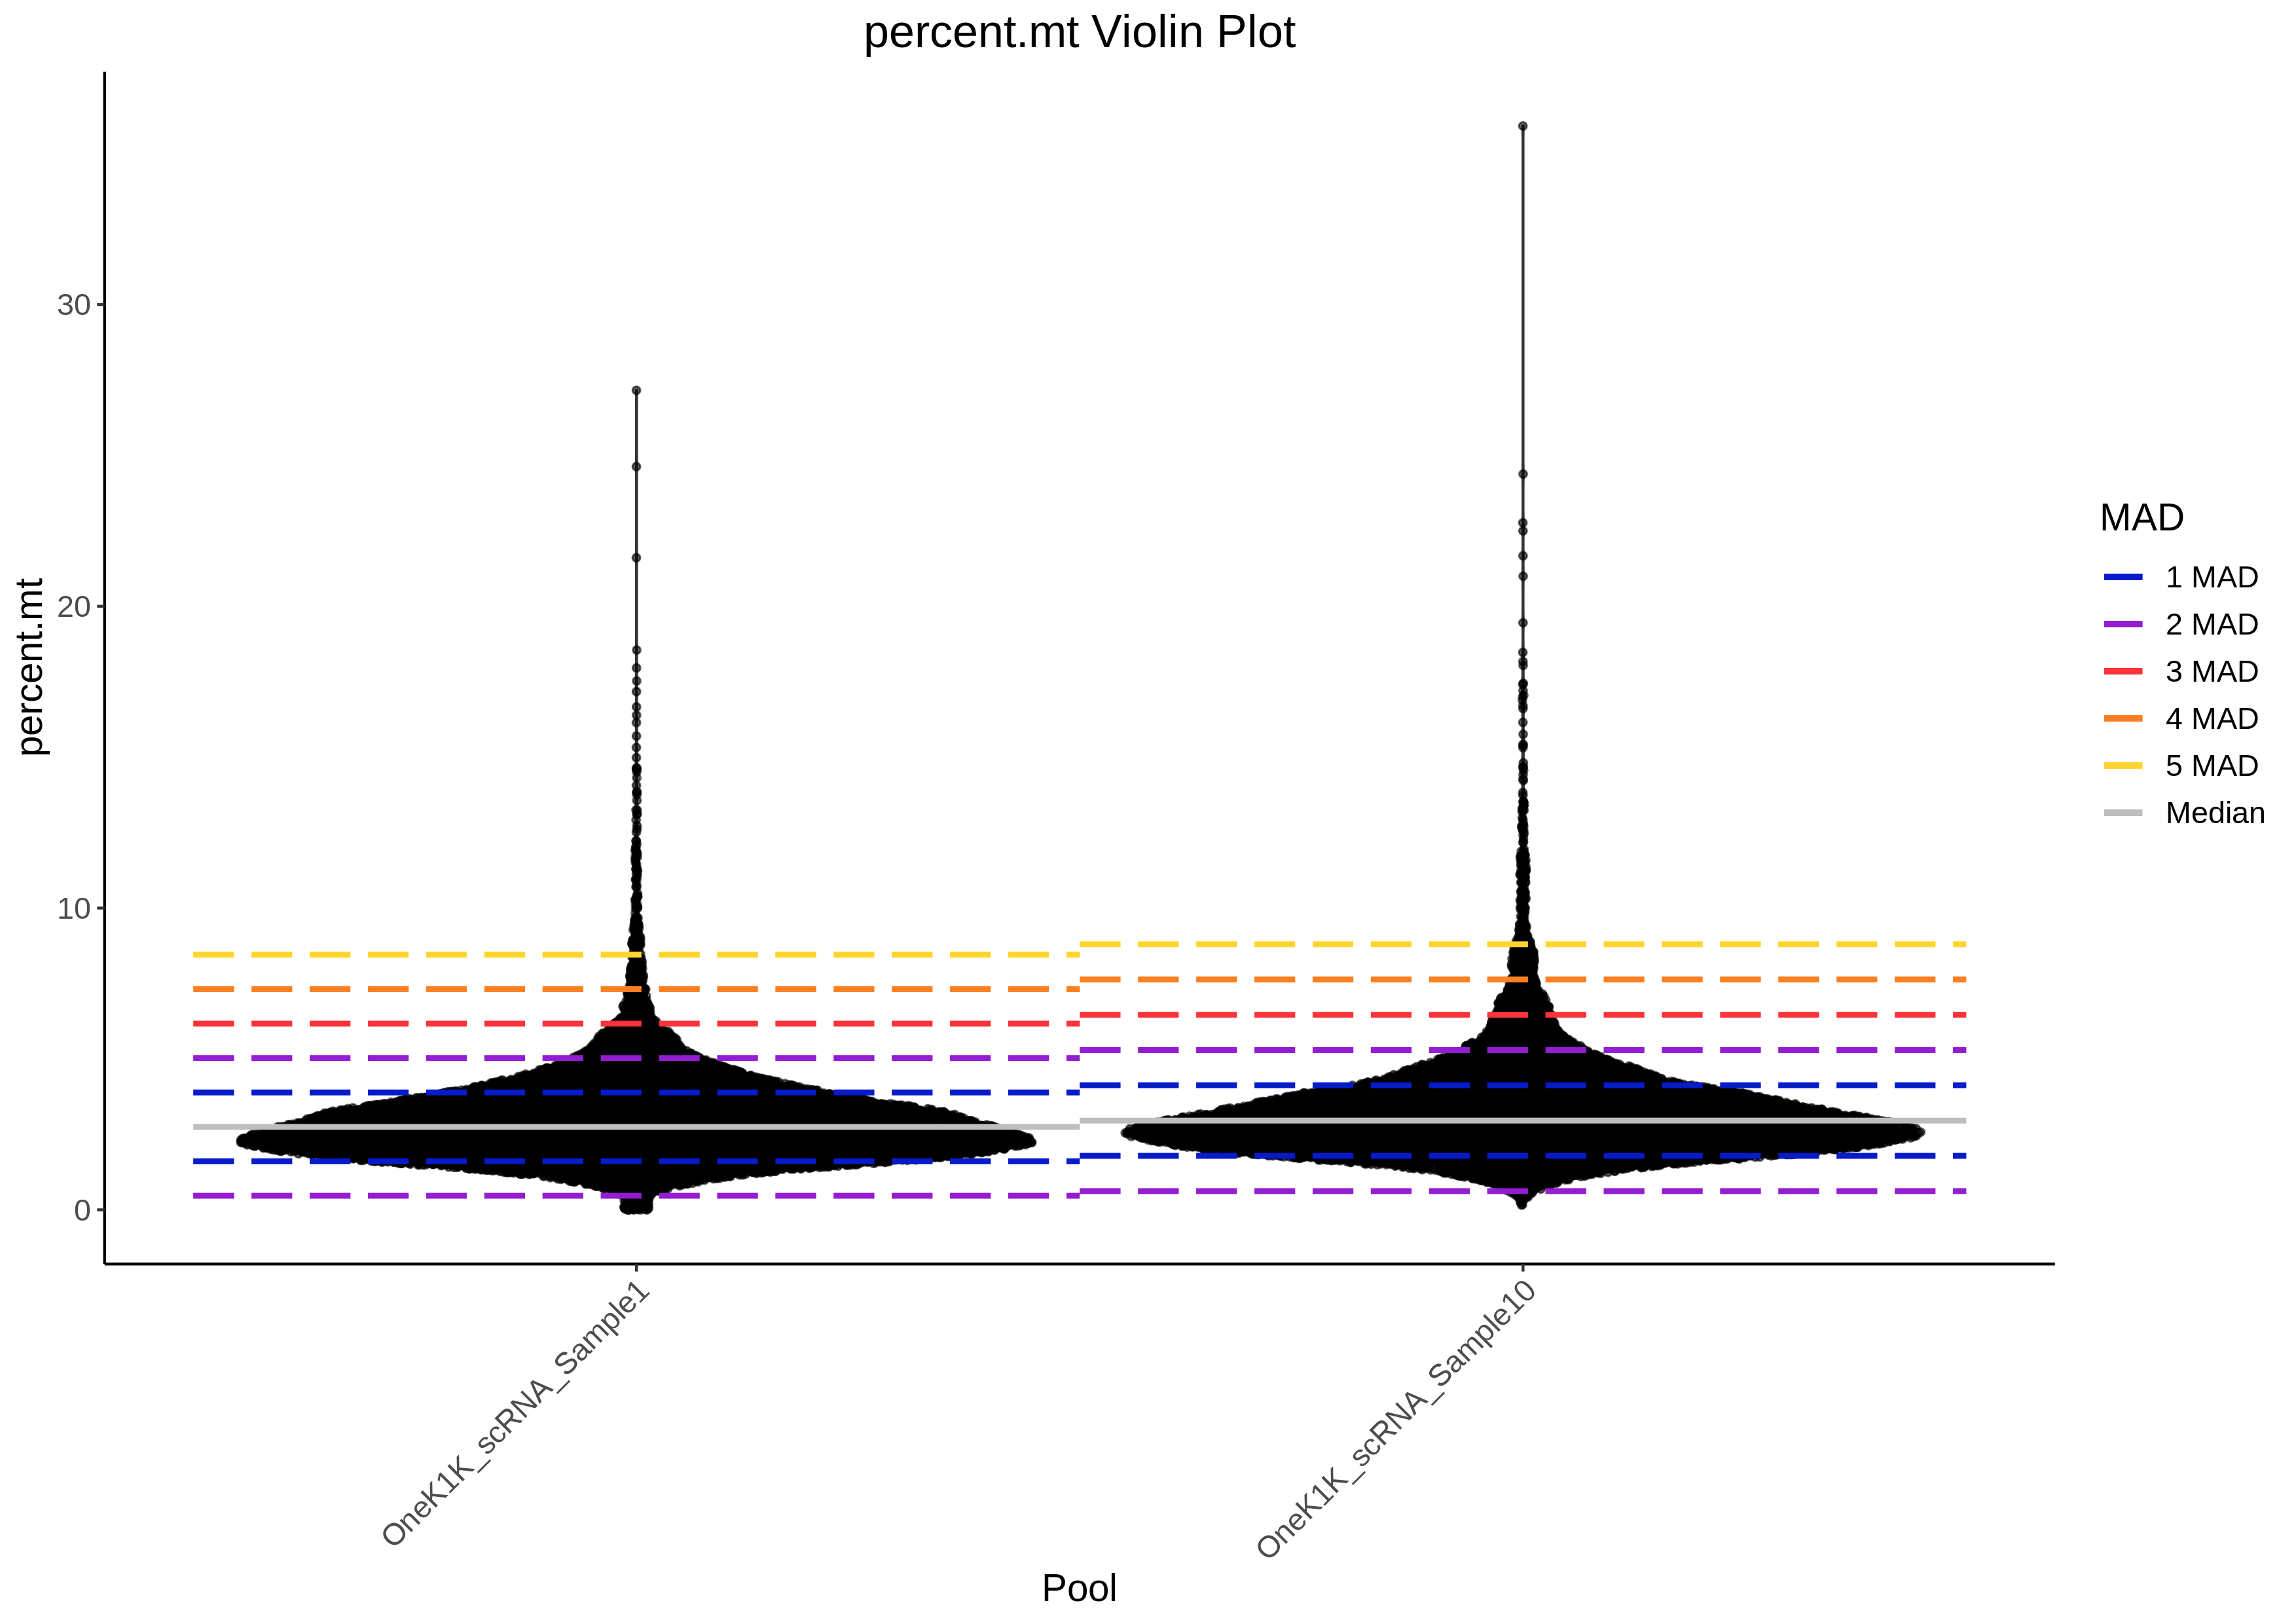
Mitochondrial Percent
Then there are a number of scatter plots that compare the QC metrics to one another:
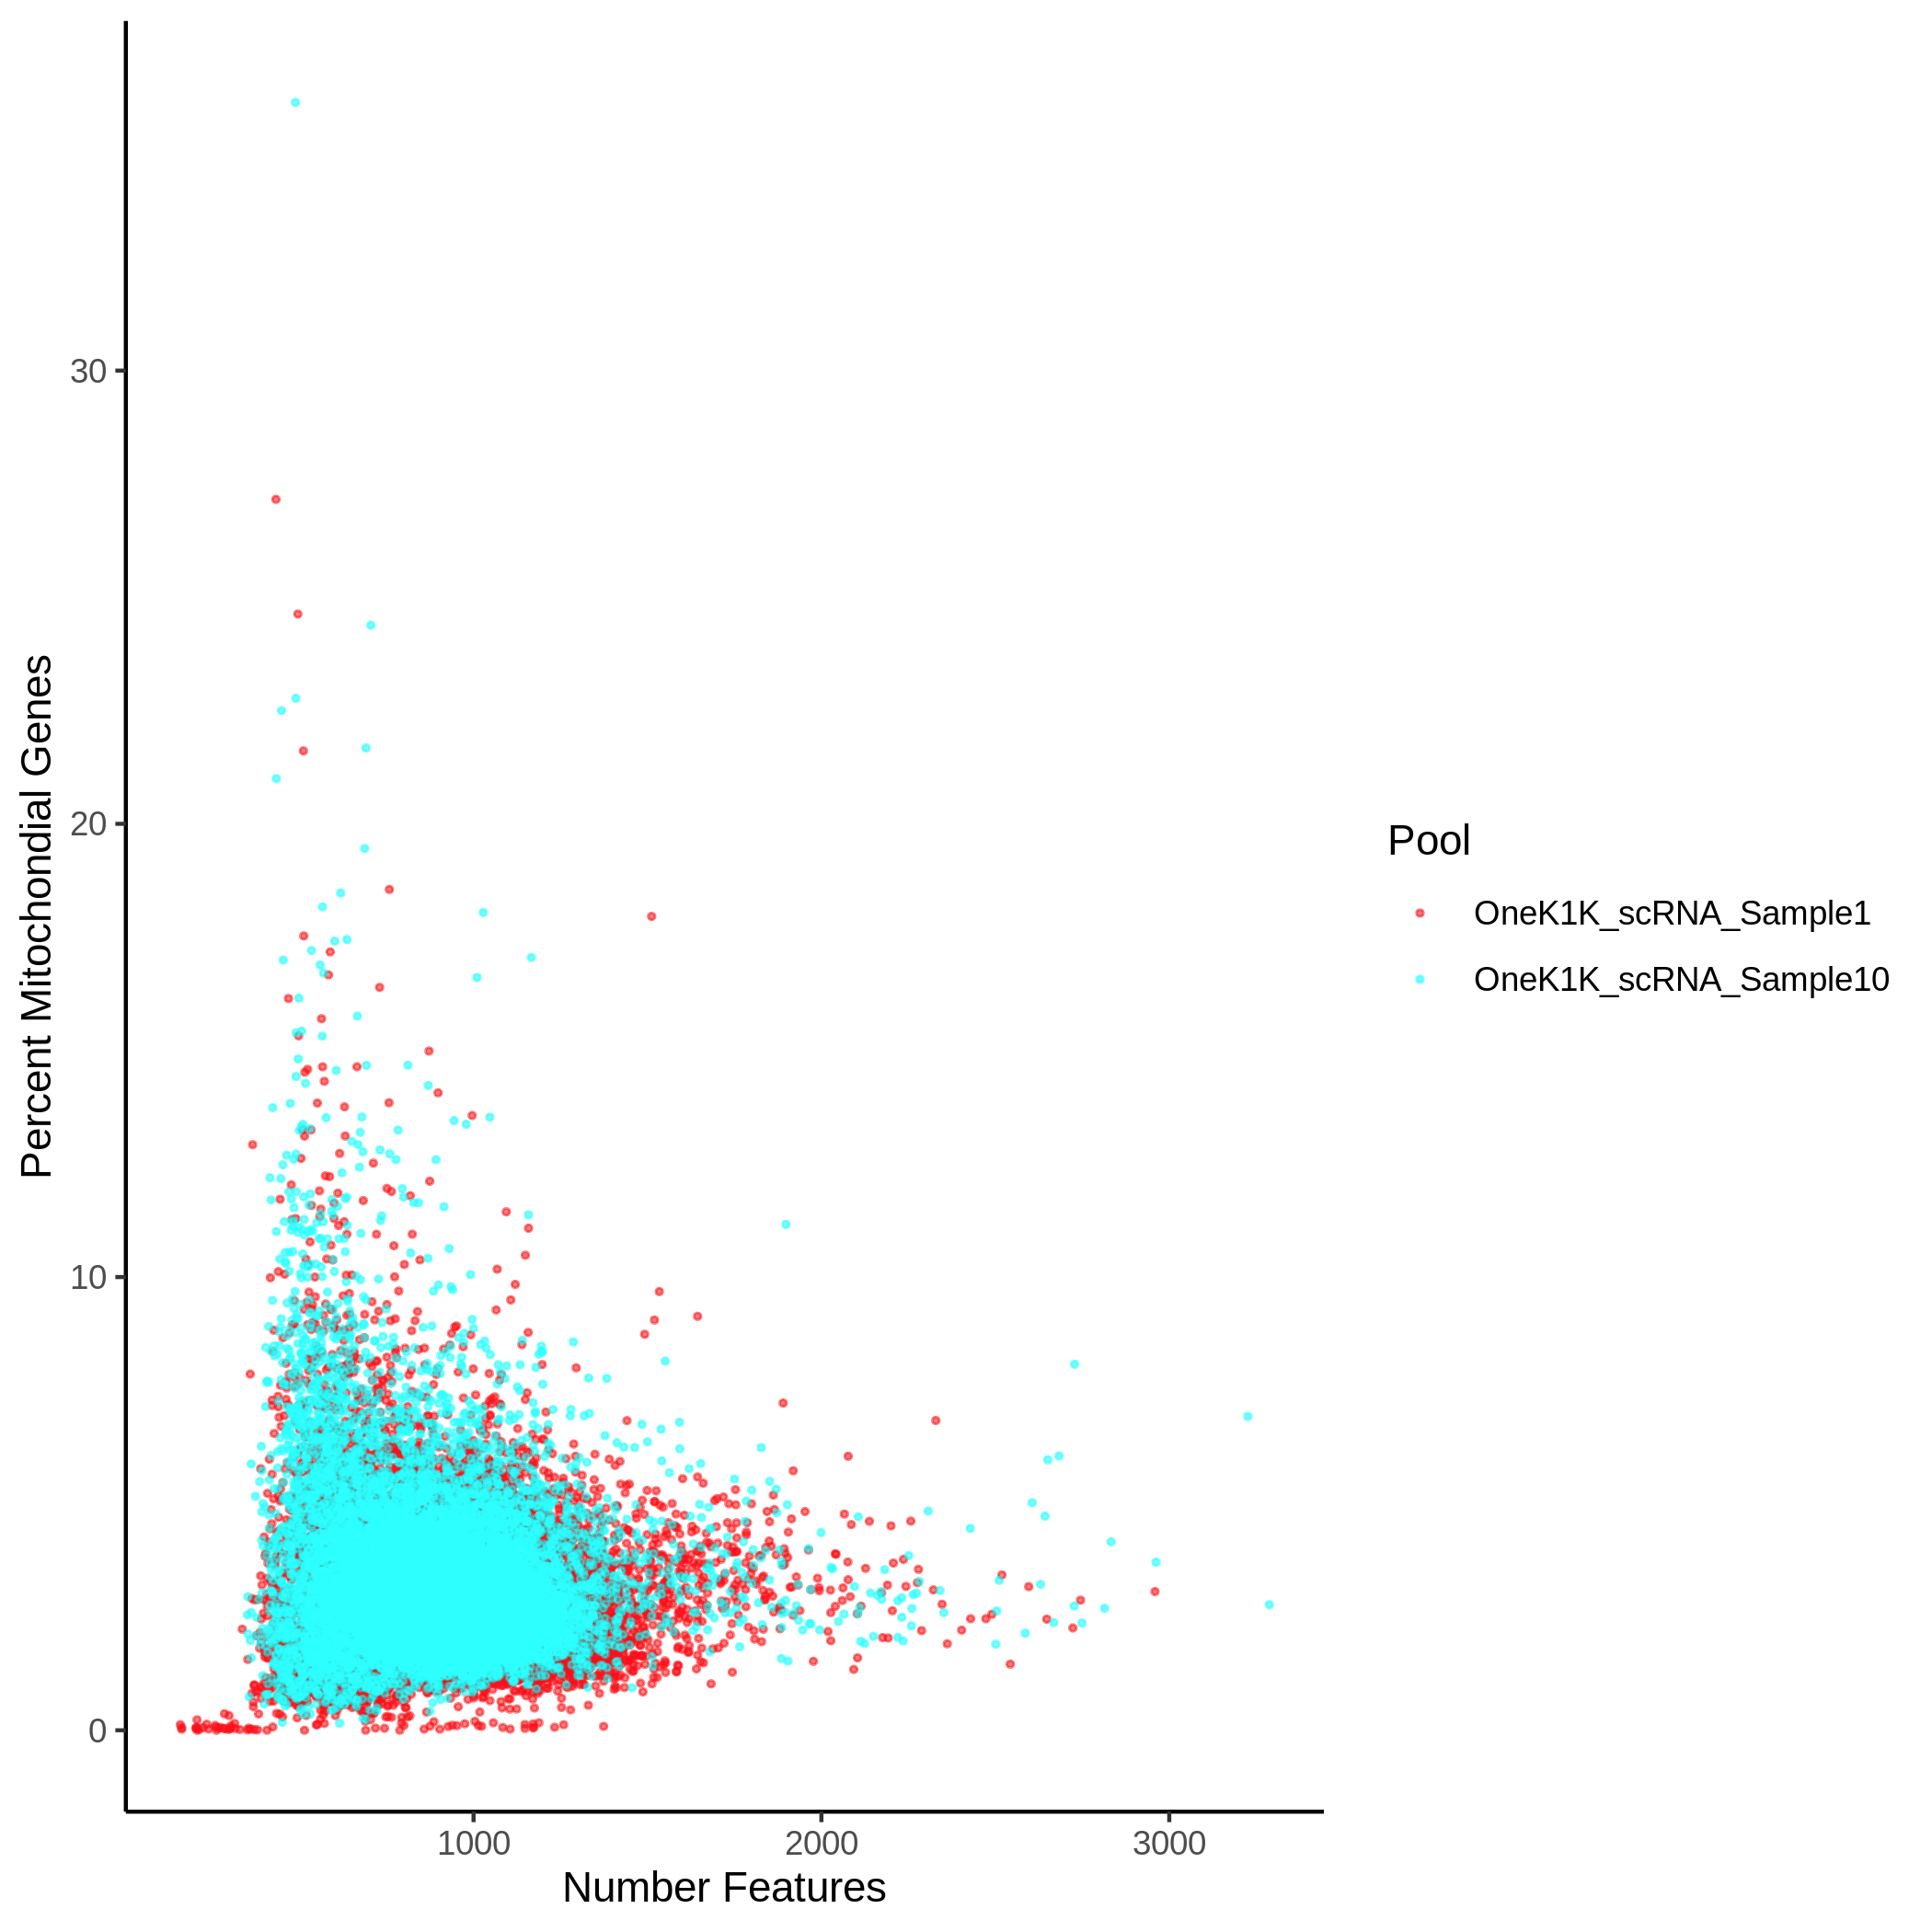
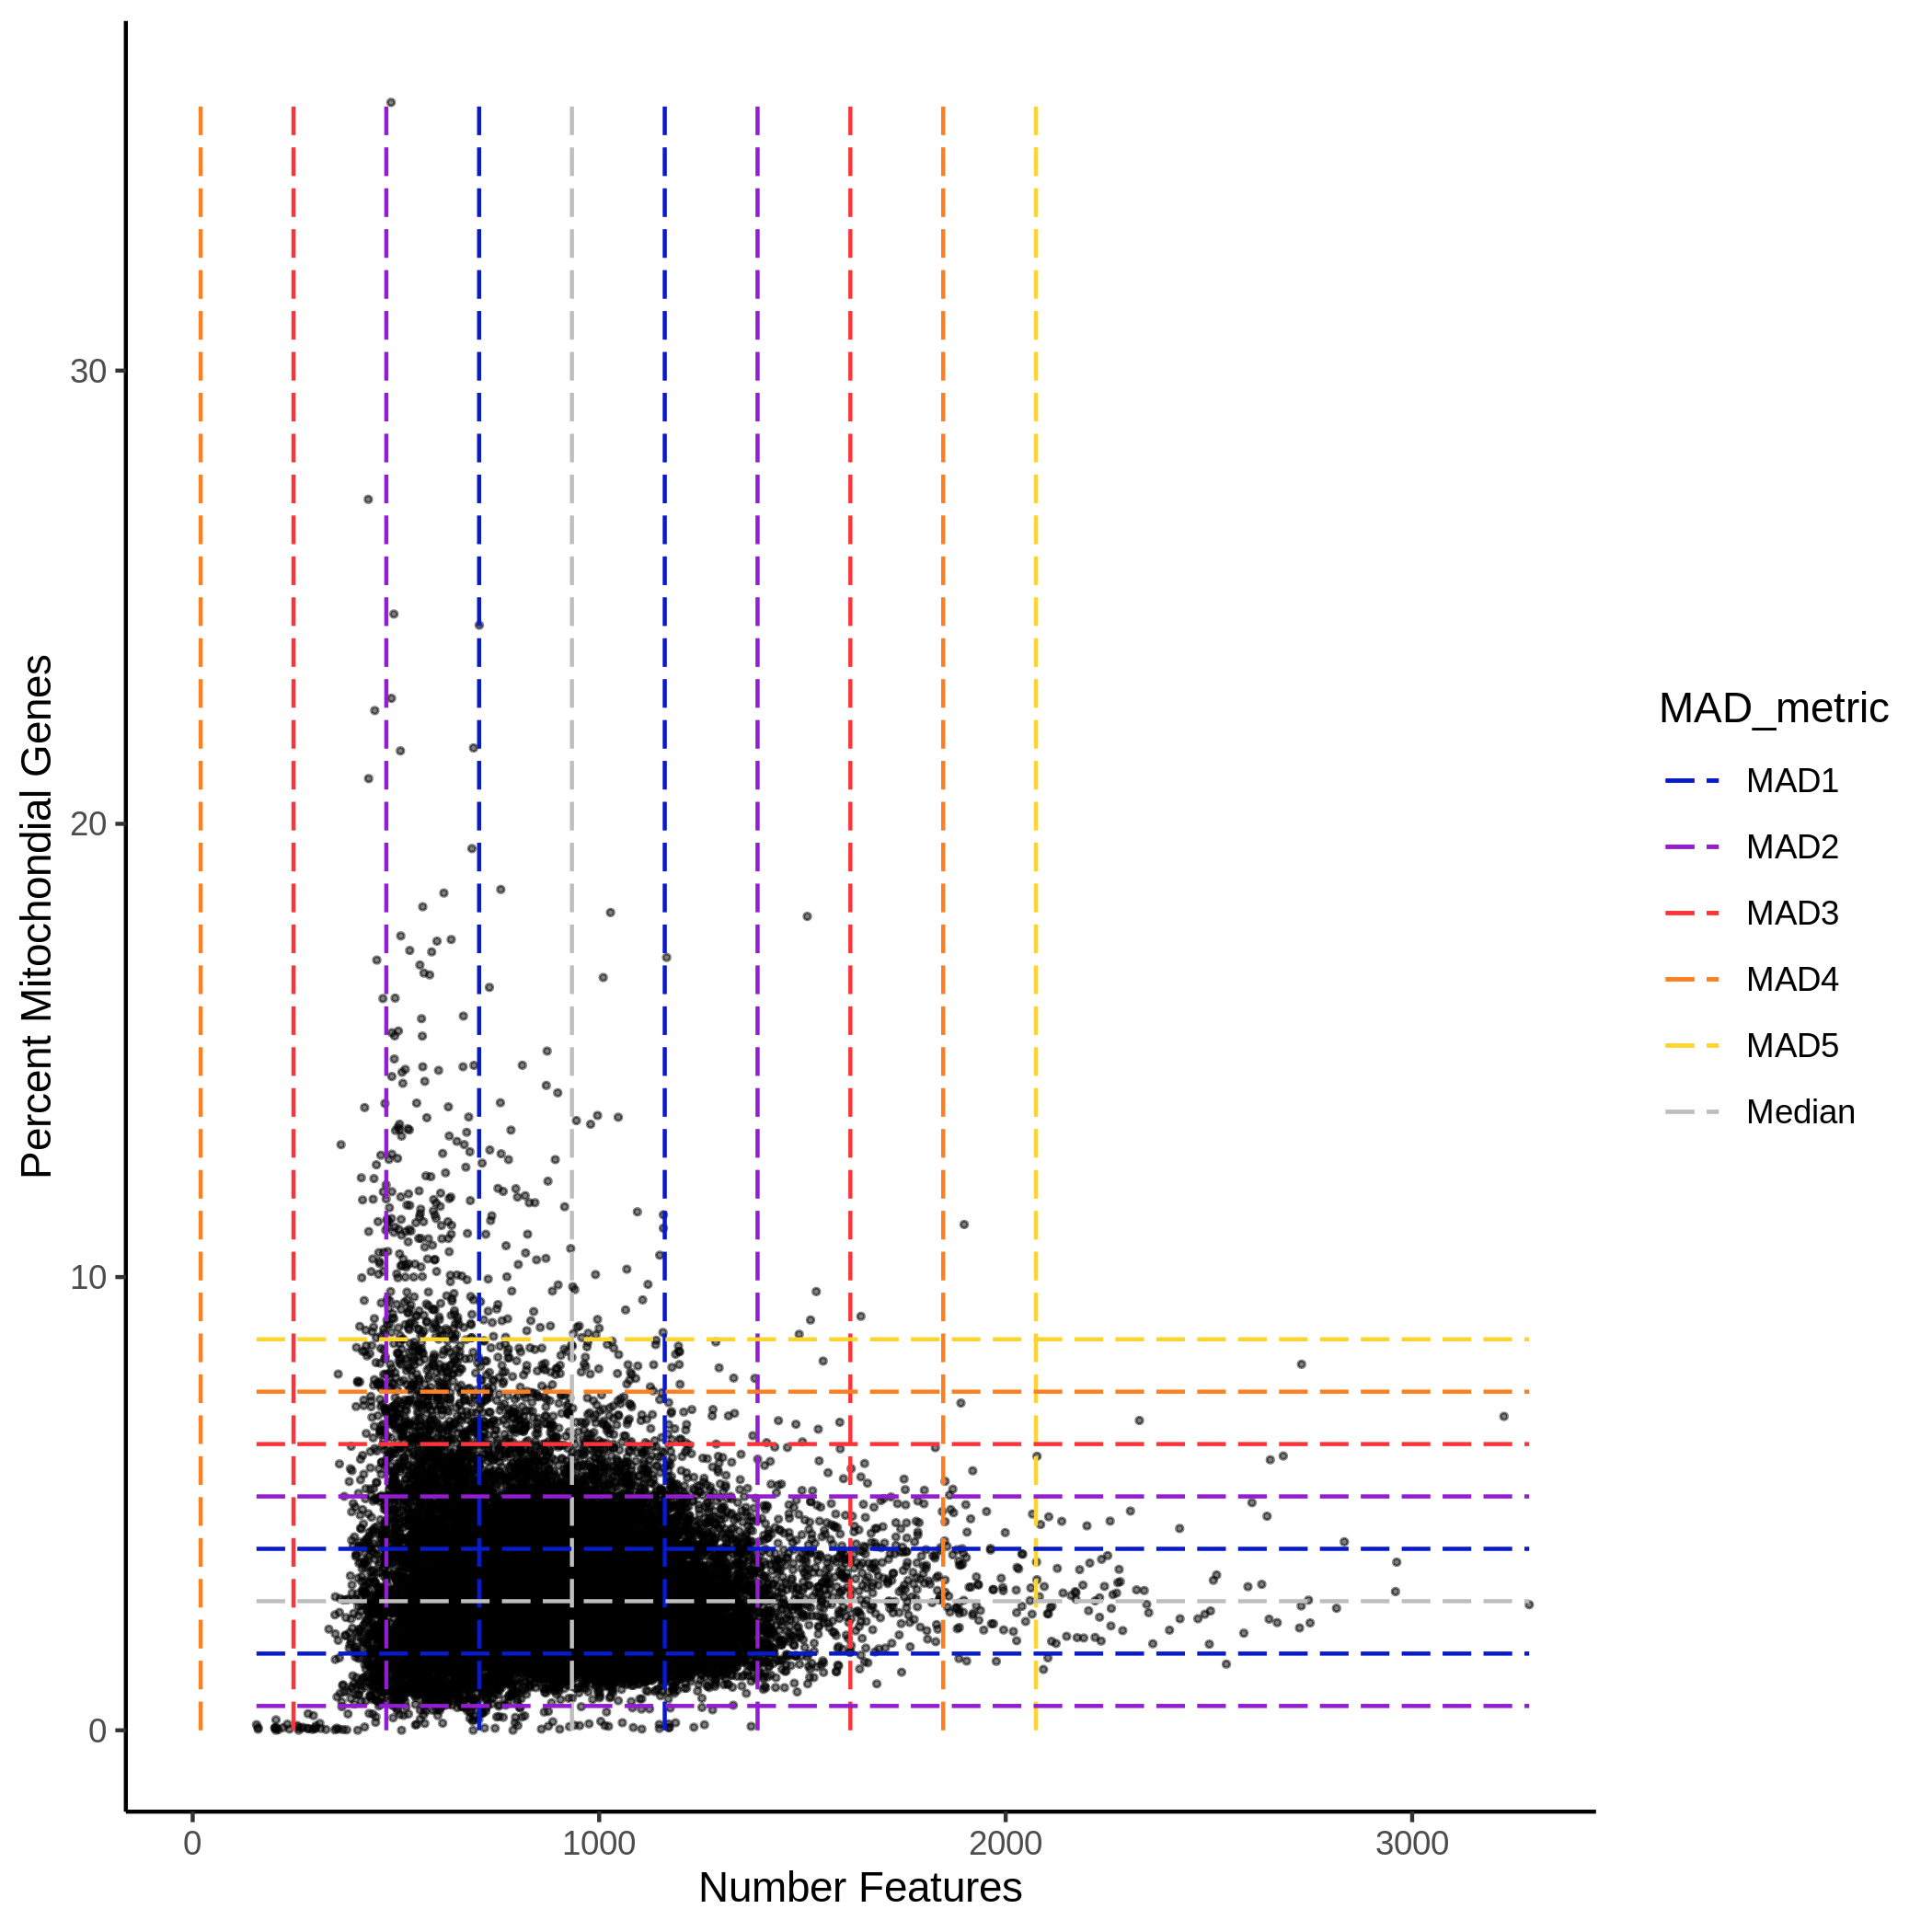
There will be two plots that compare number of features per cell vs the percent of mitochondrial content per cell where the cell is colored by pool (left) or includes lines that indicate the median and MADs from the median across all the cells for both the number of features per cell (x-axis) vs the percent of mitochondrial (y-axis). The median is in grey, 1 MAD is in blue, 2 MADs is in purple, 3 MADs is in red, 4 MADs is in orange and 5 MADs is in yellow.
Colored by Pool:
With Median and MADs:
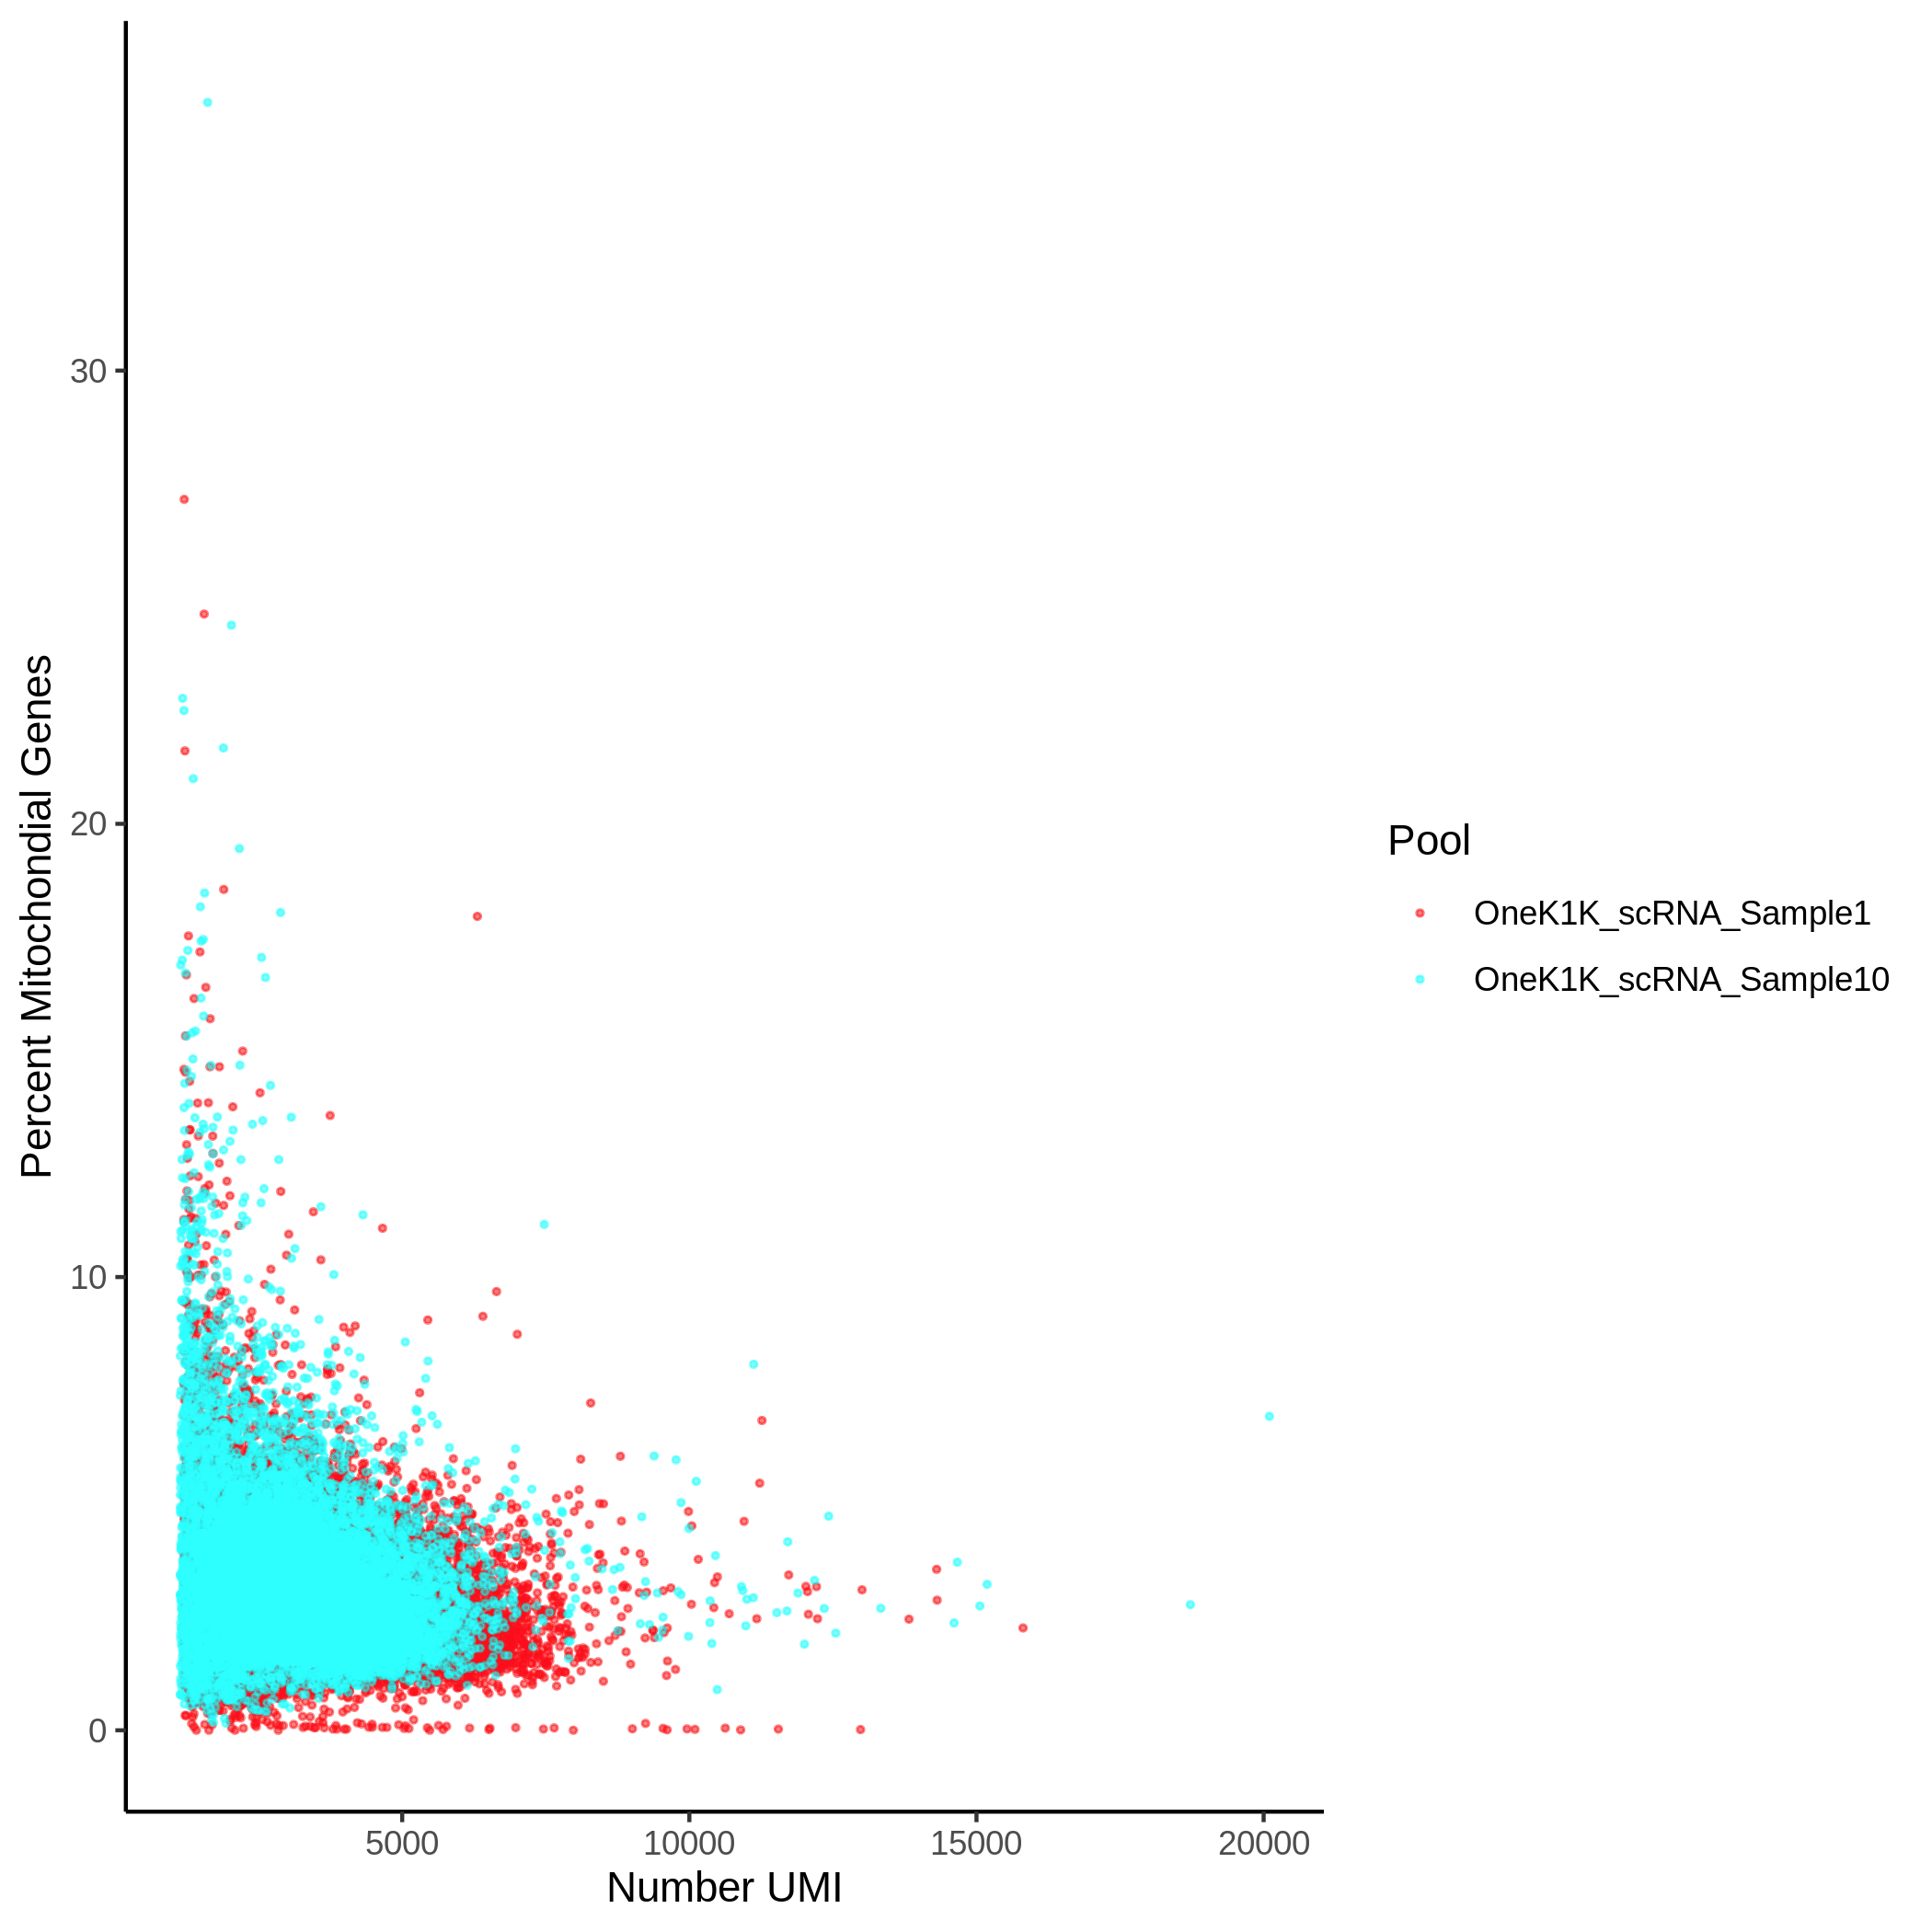
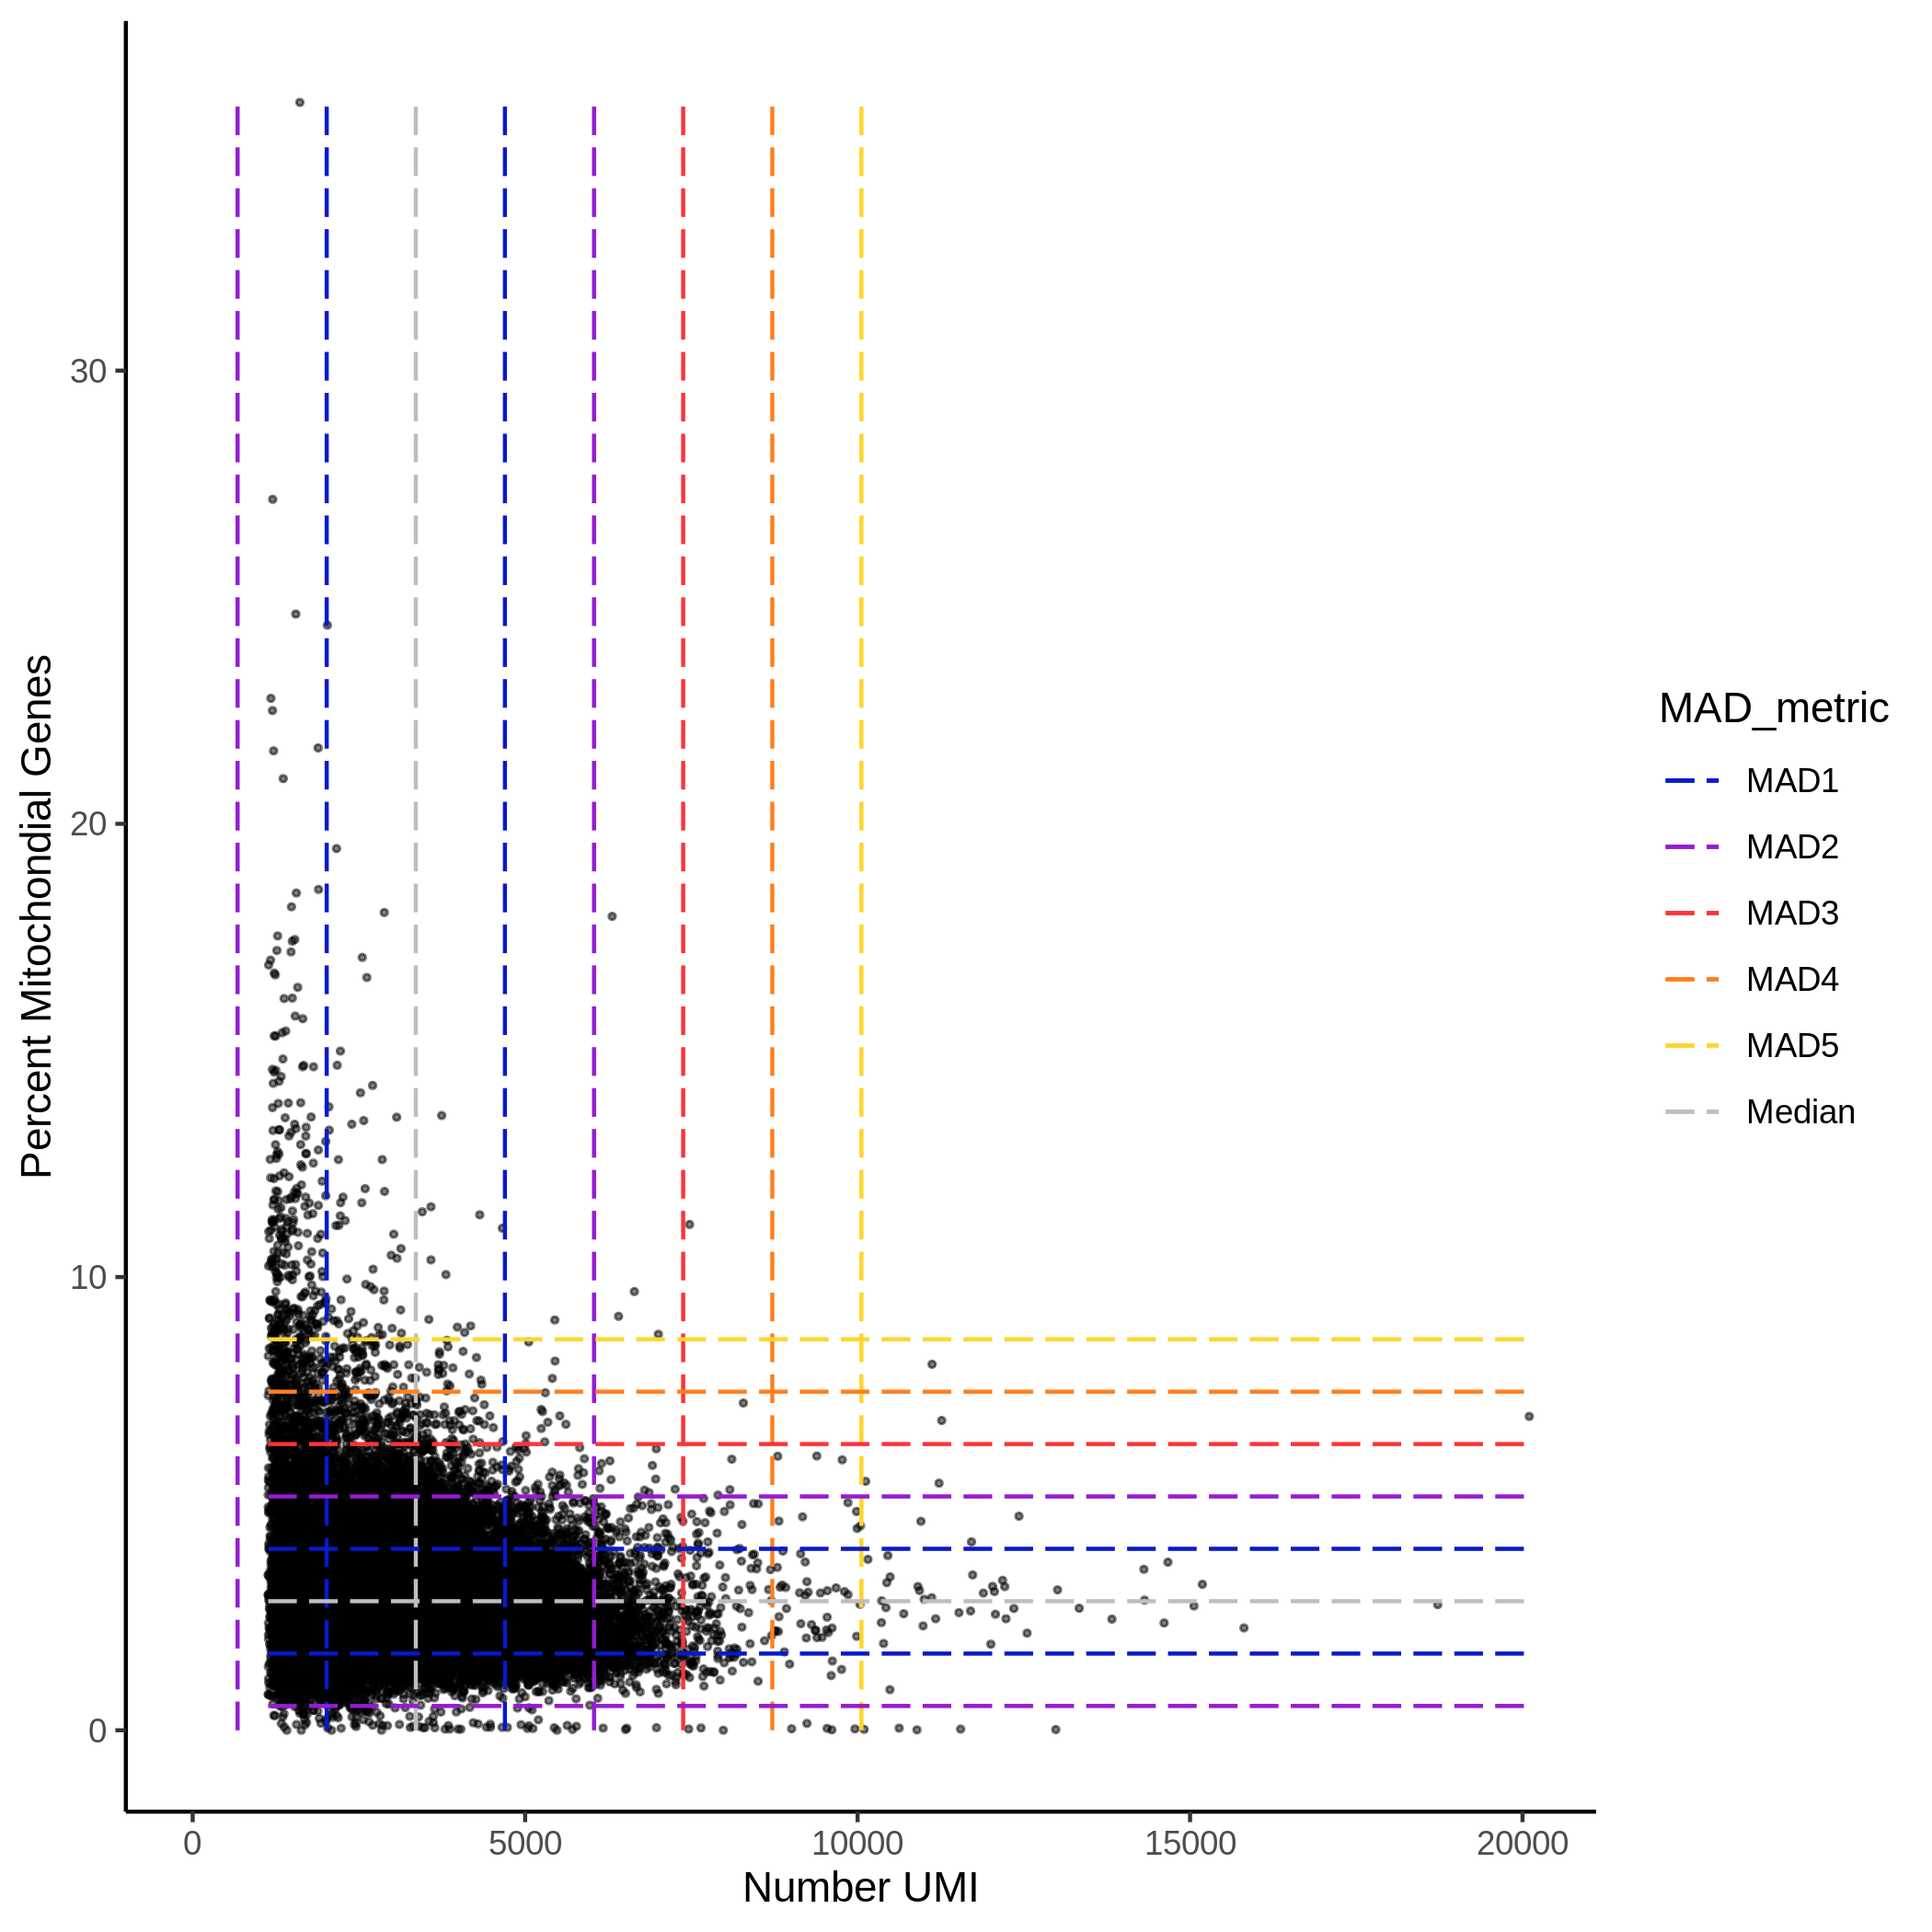
Two plots that compare the UMIs per cell (x-axis) vs the percent of mitochondrial genes per cell (y-axis) where the cell is colored by pool (left) or includes lines that indicate the median and MADs from the median across all the cells for both the UMIs per cell (x-axis) vs the percent of mitochondrial genes per cell (y-axis) (right). The median is in grey, 1 MAD is in blue, 2 MADs is in purple, 3 MADs is in red, 4 MADs is in orange and 5 MADs is in yellow.
Colored by Pool:
With Median and MADs:
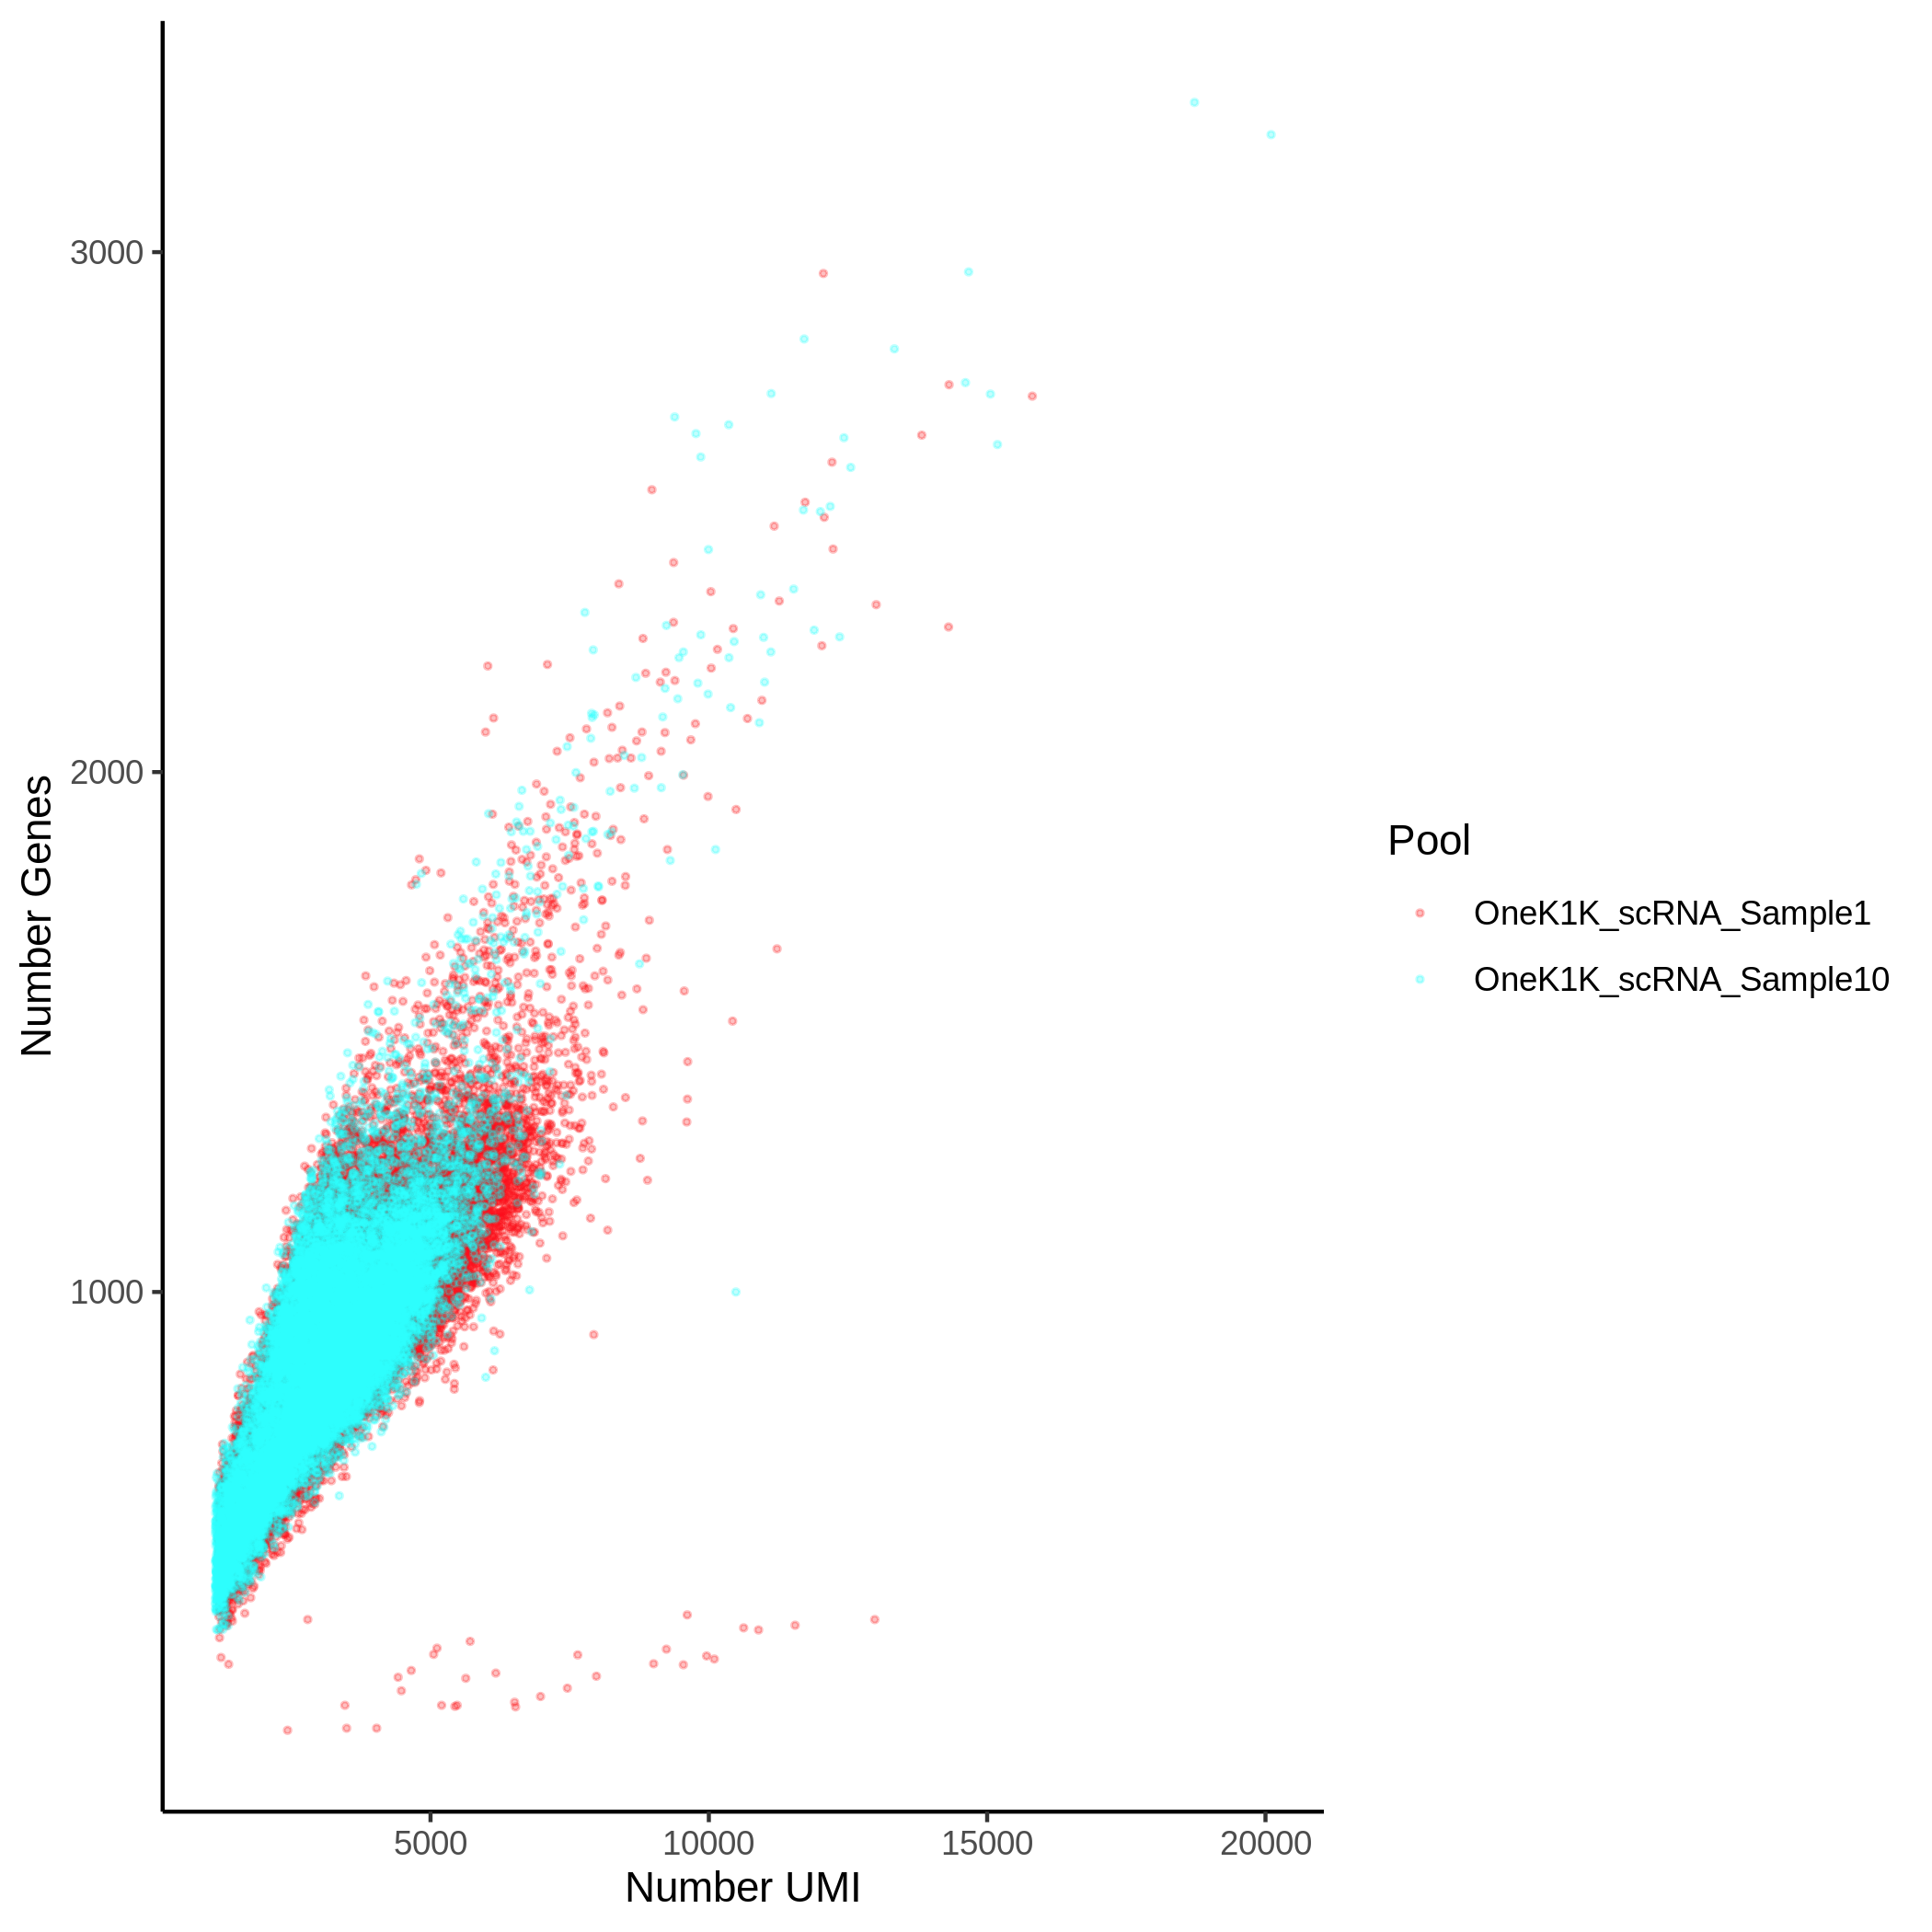
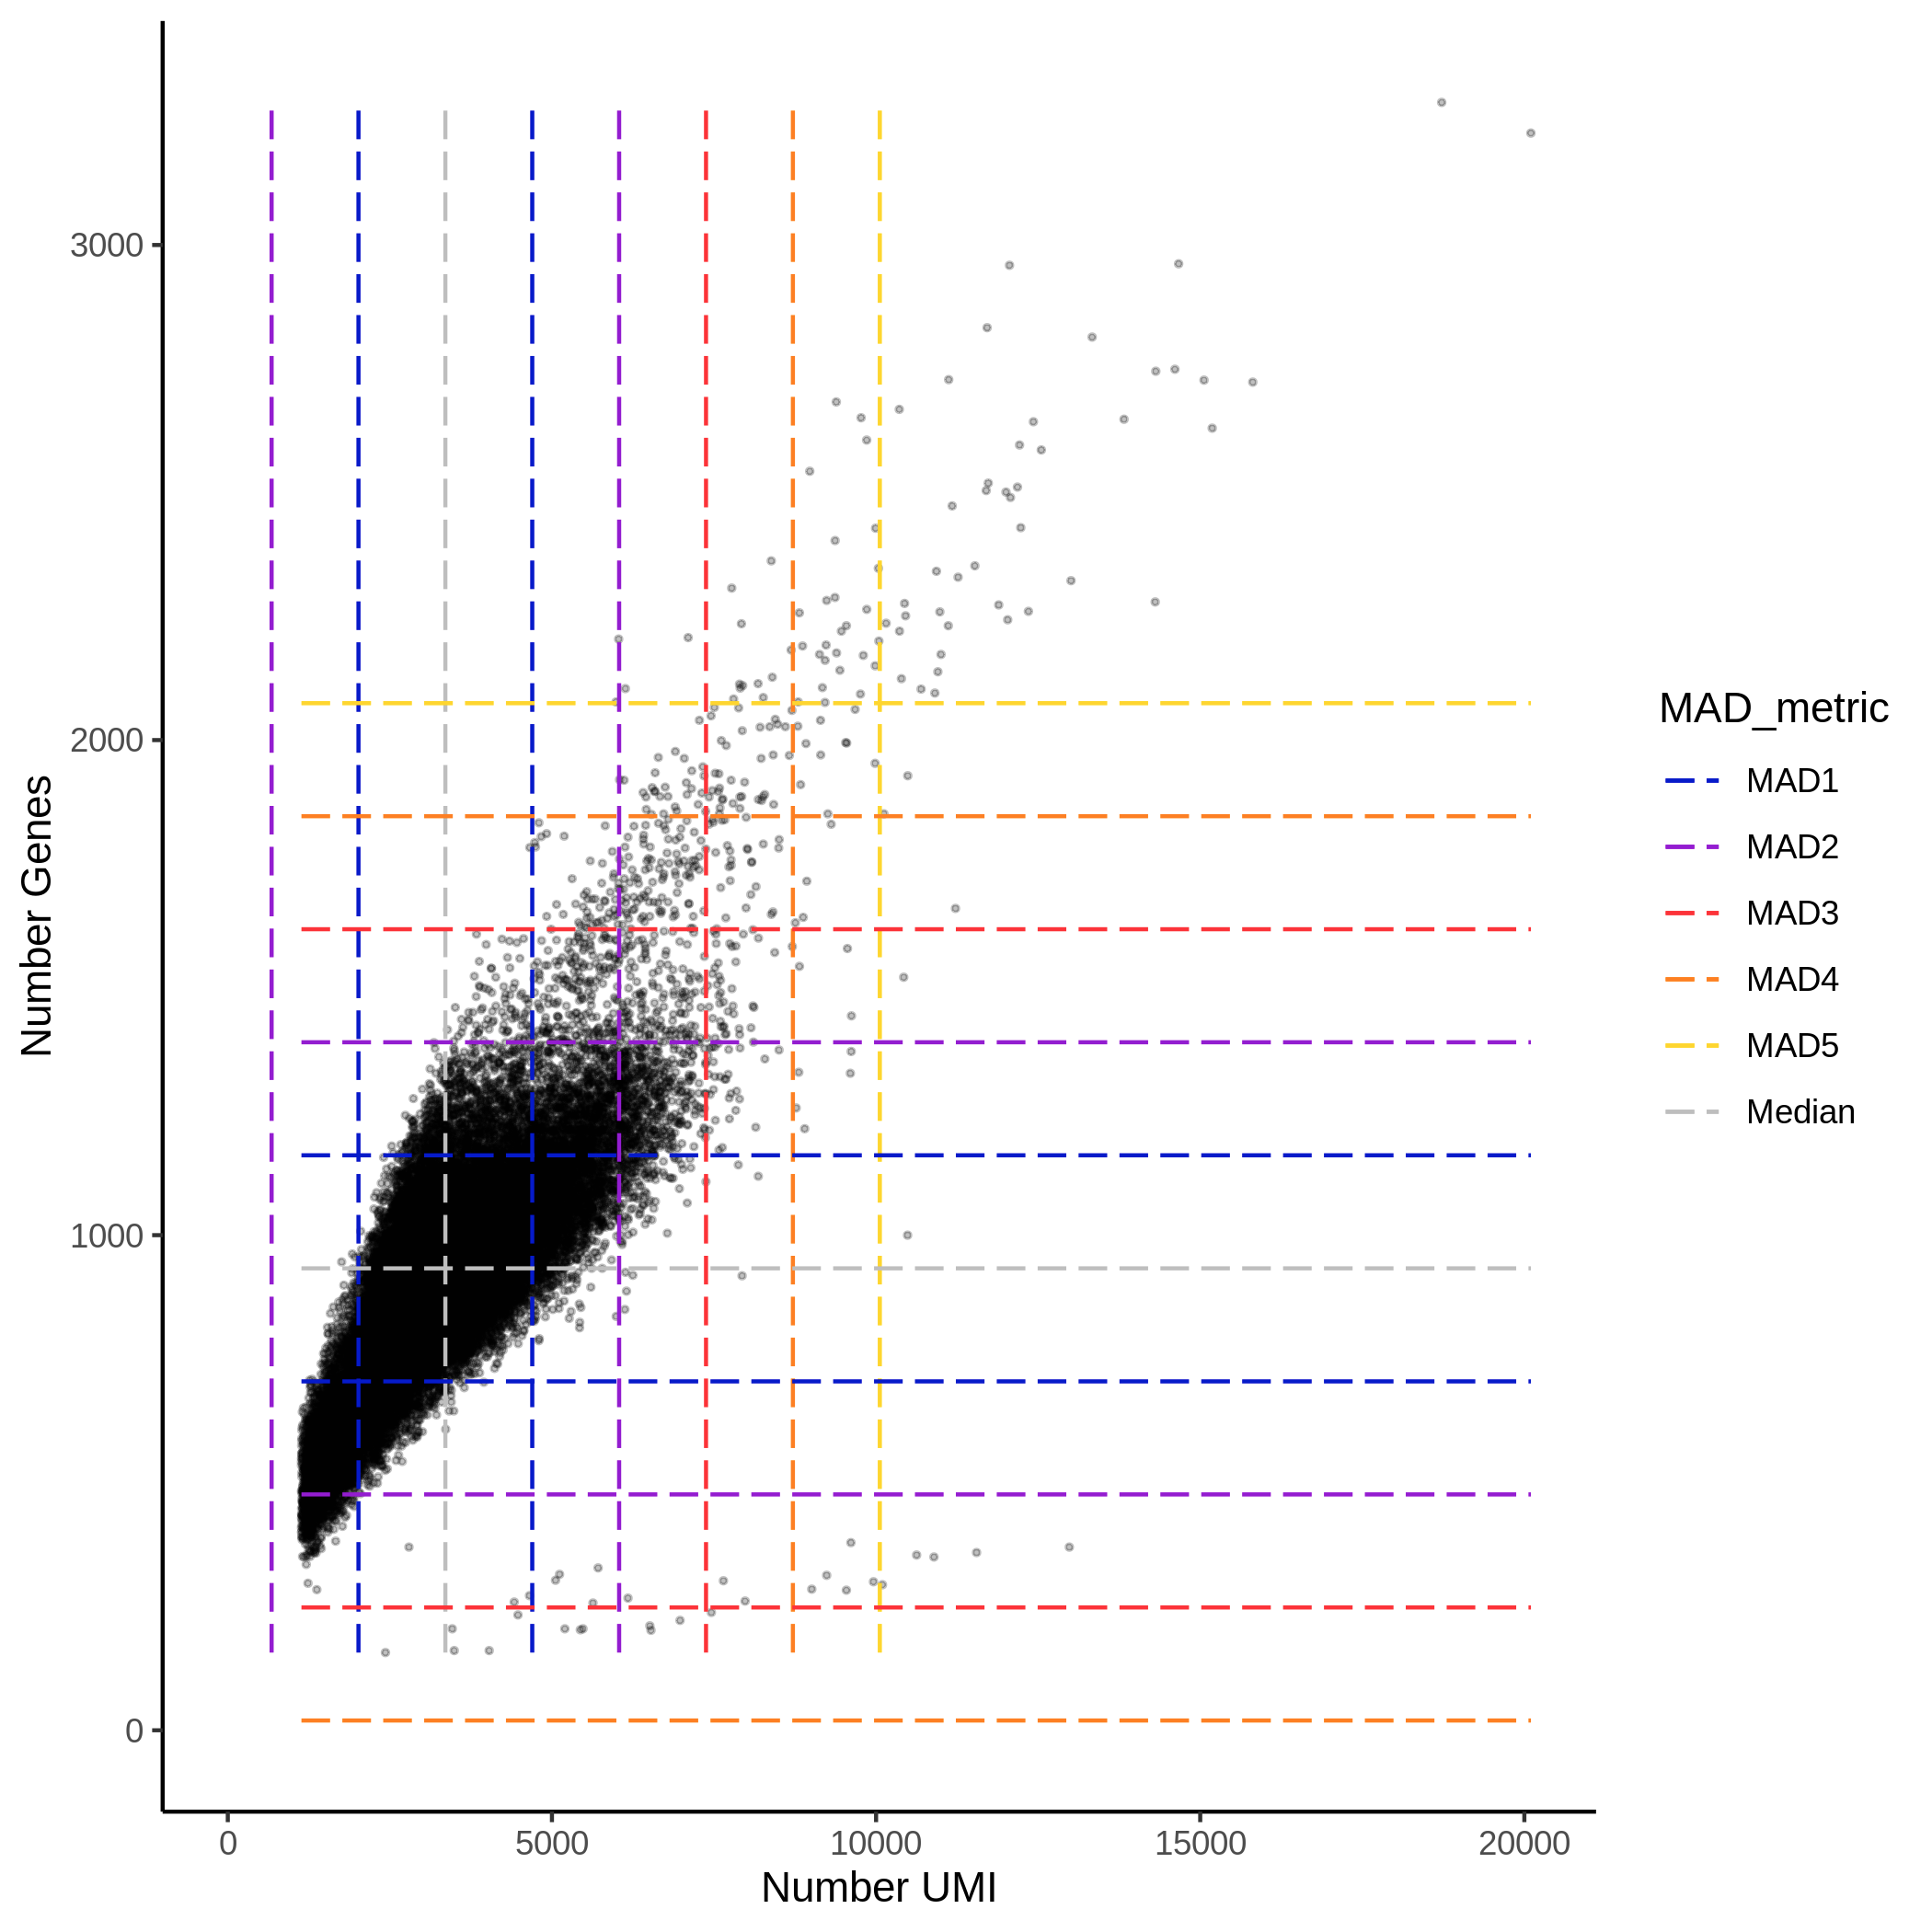
Two plots that compare the UMIs per cell (x-axis) vs the number of features per cell (y-axis) where the cell is colored by pool (left) or includes lines that indicate the median and MADs from the median across all the cells for both the UMIs per cell (x-axis) vs the percent of mitochondrial genes per cell (y-axis) (right). The median is in grey, 1 MAD is in blue, 2 MADs is in purple, 3 MADs is in red, 4 MADs is in orange and 5 MADs is in yellow.
Colored by Pool:
With Median and MADs:
These figures can be used for discussion with the other members of WG1 of the sceQTL-Gen Consortium and should help identify relevant QC thresholds for this dataset. If you require additional QC figures, you can generate them using one of the seurat objects in the output directory. All the meta.data provided in each of these objects are provided toward the end of the Demultiplexing and Doublet Removal section:
seurat_object_all_pools_all_barcodes_all_metadata.rdsto look at all the droplets from all pools and the assignments from each softwareseurat_object_all_pools_all_barcodes_final_assignments.rdsto look at the droplets from all pools and the final assignment using the intersectional methodseurat_object_all_pools_singlet_barcodes_final_assignments.rdsto look at the singlets as defined by the intersectional method
Next Steps
The next steps are to discuss the results with the consortium in order to identify filtering thresholds for your dataset. Please reach out to Drew Neavin (d.neavin @ garvan.org.au) to set up a time for a discussion once you have completed these steps. This process helps ensure consistency between different datasets used in the consortium. After discussion with the consortium, you can move to the QC Filtering section which has pseudocode to help direct how to filter depending on the method selected in discussions with WG1.